275
FFT Analysis Modes
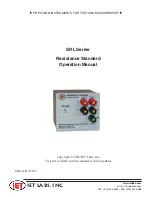
Waveform Example
Normal display
X axis: Log
Y axis: Lin-Mag
Normal display
X axis: Log
Y axis: Log-Mag
Normal display
X axis: Log
Y axis: Lin-Real
Normal display
X axis: Log
Y axis: Lin-Imag
If the cursor is displayed, the total harmonic distortion (THD) with the fundamental wave set to the
cursor position will be displayed. When 2 cursors appear, the A cursor becomes the fundamental wave.
When results cannot be obtained,
[---%]
is displayed.
Power Spectrum
Displays input signal power as the amplitude component.
Main uses:
• To inspect the peak frequency contents of a waveform
• To inspect the power level of each frequency
About the Functions, refer to “13.9.2 Analysis Mode Functions” (p. 289).
Axis
Display type
Description
X axis
Linear
Displays the frequency on a linear scale
Log
Displays the frequency on a logarithm scale
Y axis
Lin-Mag
Analysis data is displayed linearly as squared values. Indicates the power component.
Log-Mag(logarithm)
Display analysis results as dB values. (0 dB reference value: 1eu
2
)*
* eu: engineering units that are currently set are the standard (e.g., when the unit settings is volts, 0 dB = 1 V
2
)
13
FFT
Function
Summary of Contents for MR8827
Page 19: ...14 Operation Precautions ...
Page 81: ...76 Start and Stop Measurement ...
Page 111: ...106 Manage Files ...
Page 125: ...120 Miscellaneous Printing Functions ...
Page 143: ...138 View Block Waveforms ...
Page 191: ...186 Setting Output Waveform Parameters ...
Page 291: ...286 FFT Analysis Modes Measurable Ranges With Octave Analysis 1 1 OCT 1 3 OCT ...
Page 292: ...287 FFT Analysis Modes 1 1 OCT 1 3 OCT 13 FFT Function ...
Page 293: ...288 FFT Analysis Modes 1 1 OCT 1 3 OCT ...
Page 295: ...290 FFT Analysis Modes ...
Page 309: ...304 Editor Command Details ...
Page 387: ...382 Module Specifications ...
Page 405: ...400 Dispose of the Instrument Lithium Battery Removal ...
Page 431: ...A26 FFT Definitions ...
Page 436: ......