263
Screen Display Settings
13.5 Screen Display Settings
Set the display method for FFT calculation results.
Procedure
Press the
STATUS
key to open the Status screen, and then select the
[Status]
sheet.
1
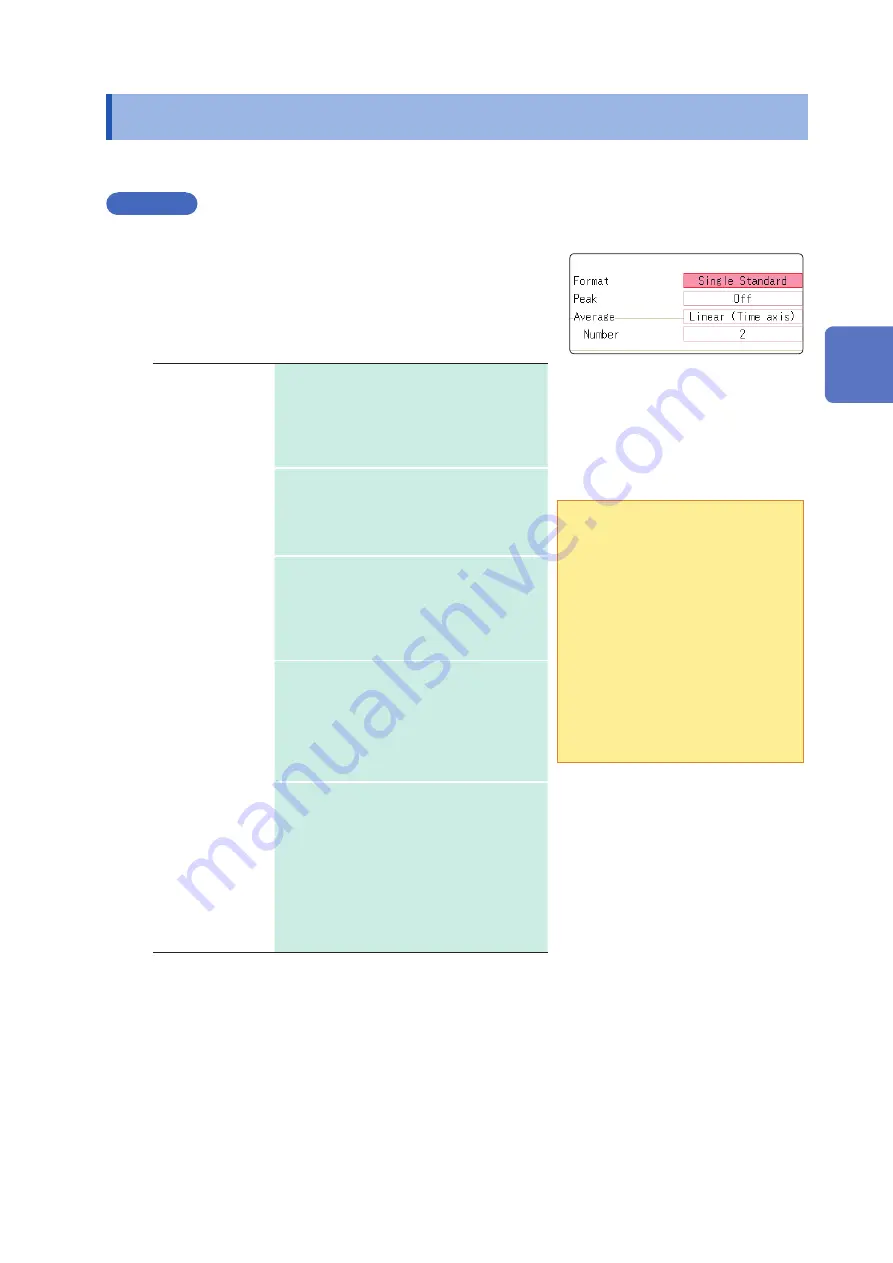
Select the display format.
Move the cursor to
[Format]
.
Select the format of data to be displayed.
The display format depends on the input data selected for
analysis.
Single Standard
The FFT calculation results are displayed in
one screen.
If the calculations have multiple settings,
waveforms will be overlaid. Note:
Depending on the analysis mode settings,
only analysis No1 may be displayed.
Dual Standard
The FFT calculation results are displayed in
two screens.
If the calculations have multiple settings,
waveforms are displayed for each specified
calculation.
Single Nyquist*
If the analysis mode is linear spectrum,
transfer function or cross power spectrum,
the FFT calculation result is displayed in a
Nyquist display on two screens.
If the calculations have multiple settings,
waveforms will be overlaid.
Dual Nyquist*
If the analysis mode is linear spectrum,
transfer function or cross power spectrum,
the FFT calculation result is displayed in a
Nyquist display on one screen.
If the calculations have multiple settings,
waveforms are displayed for each specified
calculation.
Running spectrum If the analysis mode is one of the following,
analysis results will be displayed in three-
dimensions: frequency, oscillation and time.
(Linear spectrum, RMS spectrum, power
spectrum, power spectrum density, LPC
analysis, transfer function, cross power
spectrum, 1/1 octave analysis, 1/3 octave
analysis)
If the calculations have multiple settings,
display of No1 will take priority.
* The horizontal axis and vertical axis display the real parts and
the imaginary parts of calculation results, respectively.
1
To use an existing memory
waveform for analysis
Select
[From Memory]
as the input
data source for
[Reference]
.
Refer to “13.3.2 Select the Data
Source for Analysis (Reference Data)”
To specify the analysis starting
point
Specify the starting point on the
memory waveform.
Refer to “13.8.1 Analyze After
Specifying an Analysis Starting Point”
2
Press the
DISP
key to display the Waveform screen.
13
FFT
Function
Summary of Contents for MR8827
Page 19: ...14 Operation Precautions ...
Page 81: ...76 Start and Stop Measurement ...
Page 111: ...106 Manage Files ...
Page 125: ...120 Miscellaneous Printing Functions ...
Page 143: ...138 View Block Waveforms ...
Page 191: ...186 Setting Output Waveform Parameters ...
Page 291: ...286 FFT Analysis Modes Measurable Ranges With Octave Analysis 1 1 OCT 1 3 OCT ...
Page 292: ...287 FFT Analysis Modes 1 1 OCT 1 3 OCT 13 FFT Function ...
Page 293: ...288 FFT Analysis Modes 1 1 OCT 1 3 OCT ...
Page 295: ...290 FFT Analysis Modes ...
Page 309: ...304 Editor Command Details ...
Page 387: ...382 Module Specifications ...
Page 405: ...400 Dispose of the Instrument Lithium Battery Removal ...
Page 431: ...A26 FFT Definitions ...
Page 436: ......