47
HIOKI
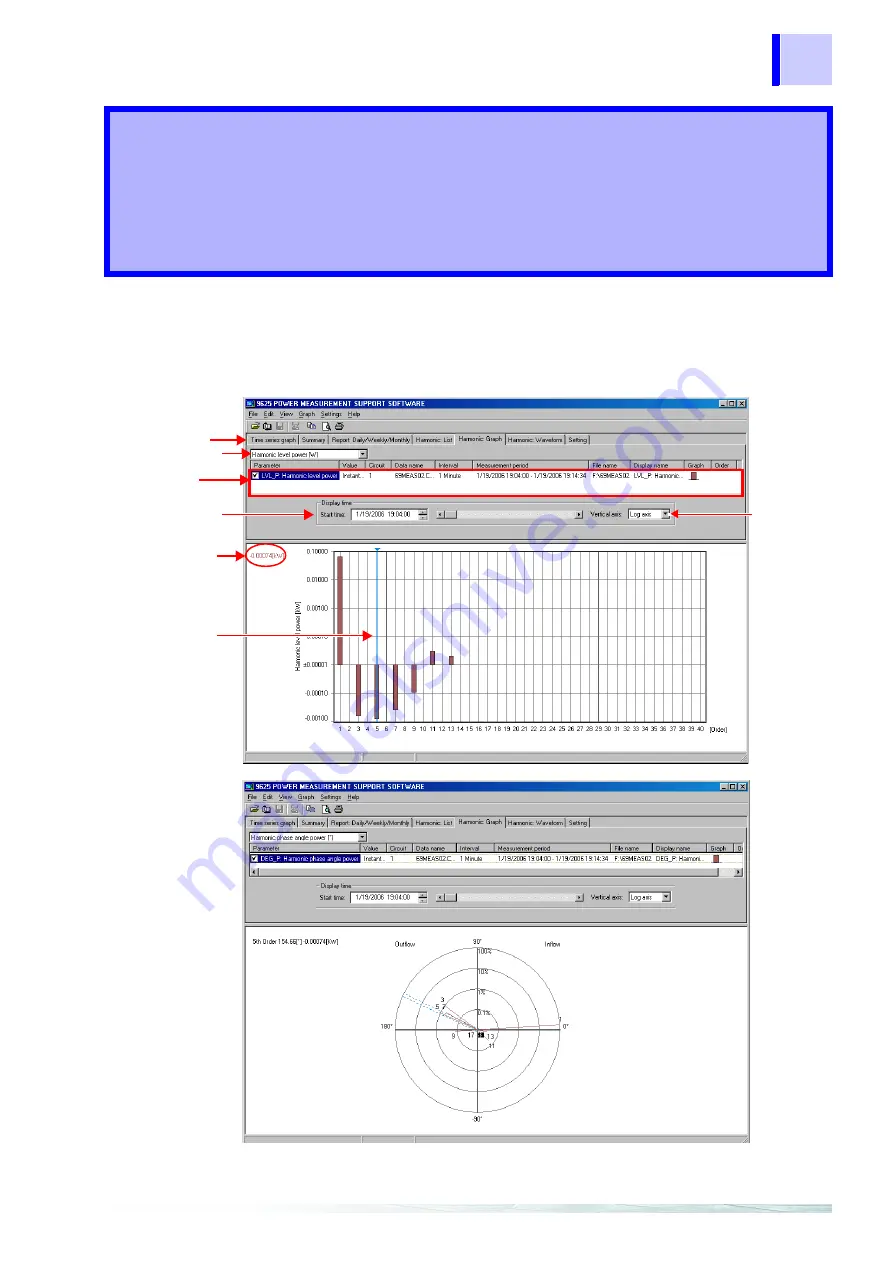
Display a bar graph of the harmonic data of a selected time. The data will be shown as a vector dia-
gram when it is the harmonic-power phase angle. A harmonic graph cannot be displayed when the
loaded data does not contain harmonic data.
Click the
Harmonic:Graph
tab to display.
Displaying a
Harmonic Graph
Chapter 8
Linear-axis/
logarithmic-
axis setting
Display-data item
selection
Detail item
selection
Display time setting
Cursor
Cursor
value
measurement
Tab
Summary of Contents for 9625
Page 1: ...POWER MEASUREMENT INSTRUCTION MANUAL 9625 SUPPORT SOFTWARE...
Page 2: ......
Page 14: ...8 1 3 Calculation Formulas HIOKI...
Page 24: ...18 2 4 Loading Saving Data HIOKI...
Page 66: ...60 HIOKI...
Page 70: ...64 HIOKI...


