5.6 Viewing Historical Data
97
1
2
3
4
5
6
7
8
9
10
5
A
ppl
ic
a
b
le
M
easurement
M
o
d
e
s
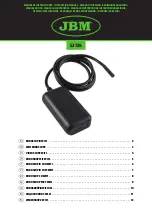
Historical measurement data can be viewed while measuring.
1.
Press the
button during repeating measurement (
HOLD
is
displayed).
2.
The bar graph indicates the sequential number of the currently dis-
played measurement.
3.
Use the
and
buttons to scroll through collected measurement
data.
5.6 Viewing Historical Data
To view INTEG (integral and interval mean value) data history:
1. After pressing the
button during repeating measure-
ment, press the
button.
2. The bar graph indicates the sequential number of the cur-
rently displayed measurement.
To view RATE (duty and operating time) data history:
1. After pressing the
button during repeating measure-
ment, press the
button.
2. The bar graph indicates the sequential number of the cur-
rently displayed measurement.
To view PEAK (peak, maximum and minimum) data history:
1. After pressing the
button during repeating measure-
ment, press the
button.
2. The bar graph indicates the sequential number of the cur-
rently displayed measurement.
• The appearance of
or
in the bar graph indicates that
either a negative or positive over-range condition occurred dur-
ing peak current measurement.
• After pressing the
button, the display of multiple bars
when you press
or
indicates that the total data up to the
present.
Summary of Contents for 3290-10
Page 1: ...CLAMP ON AC DC HiTESTER INSTRUCTION MANUAL 3290 10...
Page 2: ......
Page 6: ...iv Contents...
Page 14: ...8 Usage Notes...
Page 42: ...36 2 5 Turning Power On and Off...
Page 54: ...48 3 6 Measuring Duty by Timer...
Page 149: ...4 5 6 7 8 9 10 11...
Page 150: ......