background image

How To…


Use the Globilab Software (Android Tablet) 

 
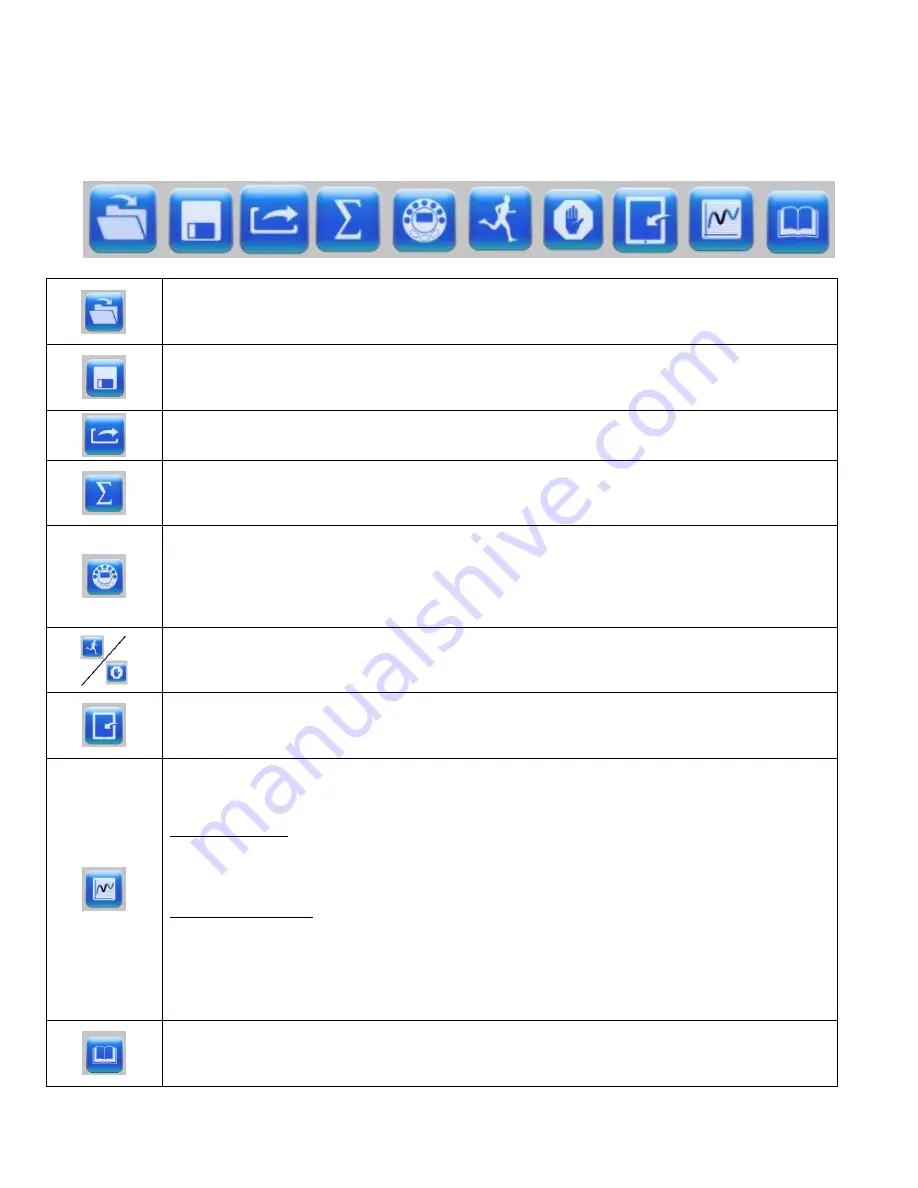
The Menu/Tool Bar 


Open Data Files

 – this opens graphs showing experiment data previously collected and saved.  

This includes both sample data files provided with the Globilab software and data that you have 
collected. 


Save

 – this saves data from a current or downloaded experiment.  Be sure to label your files 

clearly for future use.


Export

 – this exports the data in chart form into spreadsheet.


Statistics

 – this allows you to quickly see the maximum and minimum values for a specific data 

collection as well as the average reading, the standard deviation and the number of samples and 
sampling rate.  


Set up

 – this allows you to select which sensors and set up the desired collection rate and 

collection size from the tablet rather than from the Labdisc itself.  In order to use the set up 
button, the Labdisc must be connected to the tablet by either a Bluetooth connection and must 
not be running an experiment.  Keep in mind that different sensors have different maximum 
sampling rates.  Globilab will limit the collection rate to that of the slowest sensor. 


Run/Stop

 – this allows you to begin or stop the collection of data.  Like the set up button, this 

button will only work if the Labdisc is connected to the tablet by a Bluetooth connection.


Download

 – Select and download data from any experiment remaining on the Labdisc.  The 

Labdisc’s memory can save up to 127 recordings and will show date/time, number of samples , 
rate of collection and which sensors were used. 


Mathematical Functions

 – Globilab allows you to apply two different mathematical functions to 

your data. This drop down menu will allow you to select either: 
 
Linear Regression – is used to display the best linear line to fit the graph between two markers.  A 
pop up box will display the mathematic formula for the line between the two markers in the Y = 
aZ + b format. 
 
Quadratic Regression – is used to display the best parabolic line to fit the graph between the two 
markers.  The pop up box will display the mathematic formula for the line between the two 
markers in the Y = aX

2

 = bX = c format. 

 
To set a marker on your graph line, simply press and hold the place on the line where you want 
the marker to be.


Activities

 – this opens pdf files of lesson plans.


Summary of Contents for Labdisc

Page 1: ...Getting to Know the Labdisc Globimate version www globisens com...

Page 2: ...4 Set up 4 Run Stop 4 Download 4 Mathematical Functions 4 Activities 4 Working On A Smaller Screen Error Bookmark not defined Other Software Features 5 Zoom 5 Marker 5 Annotate 5 Display Options 5 Use...

Page 3: ...Error Bookmark not defined Turbidity Sensor 7 UV Sensor 8 Voltage 8 Available External Sensors 8 Dymo Wireless Force Accelerometer Error Bookmark not defined Voltage Sensor Error Bookmark not defined...

Page 4: ...to confirm your choice Options include manual 1 second 10 second 100 second 1000 second and 25000 second The rate of collection by some sensors is limited and so you may not see all of the options for...

Page 5: ...sensors are available If you are using a Globisens brand external sensor attached to the Universal Adapter port it will show up in the set up menu after you have attached it If you are using a sensor...

Page 6: ...be in different places on different tablets It may be a column of three small boxes to the far right at the top of the screen or it may be a small menu at the bottom of the screen near the back arrow...

Page 7: ...rates Globilab will limit the collection rate to that of the slowest sensor Run Stop this allows you to begin or stop the collection of data Like the set up button this button will only work if the L...

Page 8: ...and drag the bubble anywhere within 360 degrees of its insertion point You can also lengthen shorten the leader to the text by dragging the text bubble closer to further from the insertion point To mo...

Page 9: ...Press and hold the colorimeter button on the Labdisc until you hear a long beep When finished the calibration remove the cuvette from the colorimeter To take a data reading fill the cuvette full with...

Page 10: ...g turn The pH meter will measure the H ion activity in a solution The pH sensor is factory calibrated and under normal conditions does not require any calibration If you need to calibrate this sensor...

Page 11: ...ation You will see the blue light flash 3x Then right click on the Bluetooth icon in the lower right corner of the Globilab window and click on Find More Labdiscs and sensors When the add a device win...

Page 12: ...ndividual wave forms of each heartbeat but will not show a graph line indicating the overall heart rate The pulse waveform will be measured in Volts V Respiration Prior to using the Respiration sensor...

Reviews: