GE
D
IRECTION
FQ091019, R
EVISION
2
V
IVID Q
N S
ERVICE
M
ANUAL
Chapter 7 - Diagnostics/Troubleshooting
7-87
shown below. The messages
Init Done
and
Please
Wait
are displayed beside the progress bar in the
Status
area.
As the testing sequence progresses, the progress bar will advance to reflect the test progress.
Status indicators in the Data Flow map corresponding to the various system components will be
highlighted in the appropriate color to indicate the current test status, as follows:
•
Green:
All recommended tests for these components have been completed and no problems
were identified.
•
Red:
Problems were identified in these components during the performance of the test.
•
Yellow:
The tests executed so far on these components have passed, but not all
recommended tests have been performed.
6.) At any stage, trackball to the
Pause
button and press
Set
, if required.
7.) To resume testing (from the point where you paused), trackball to the
Start
button and press
Set
.
When the Full System Monitoring Test sequence is complete:
-
the
Diagnostic
Test
window displays the Finished message
-
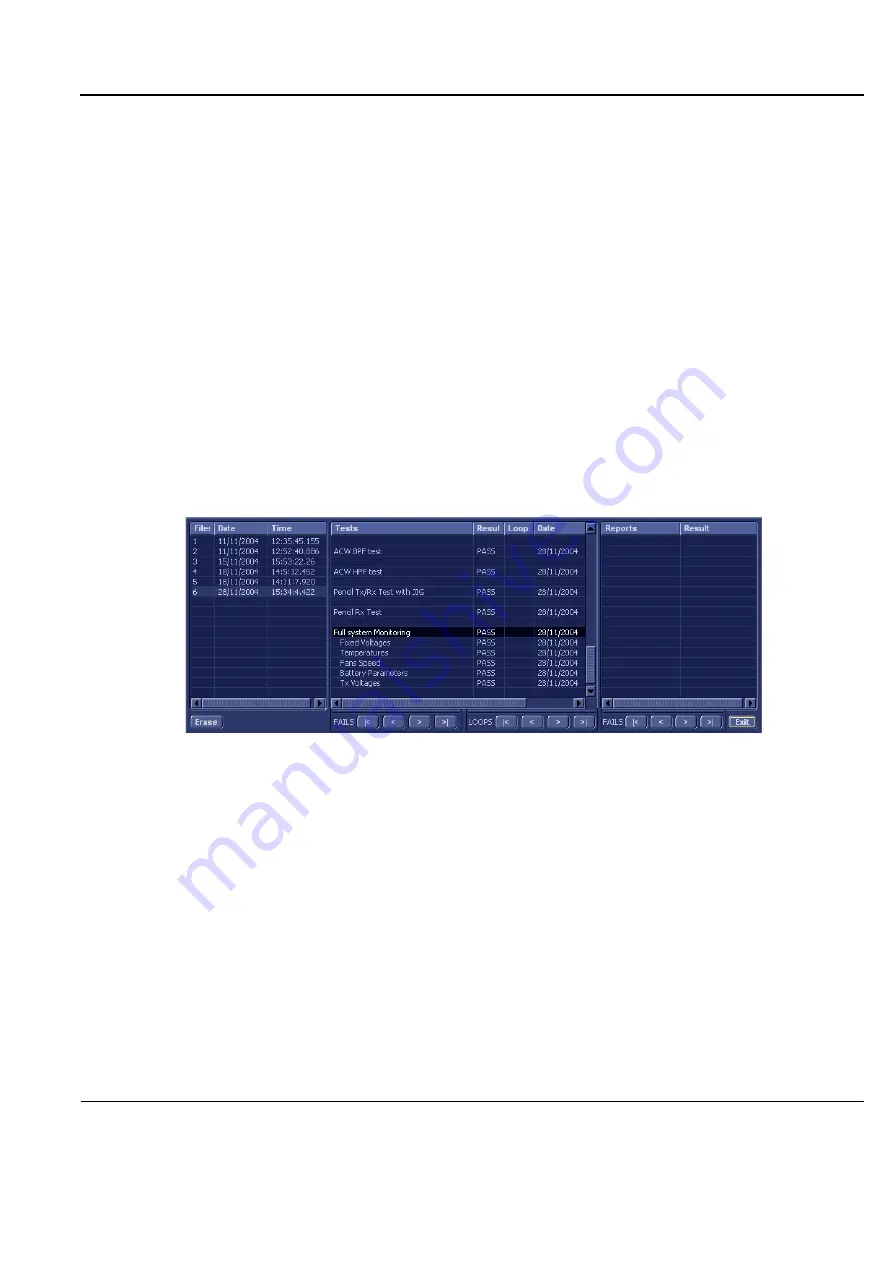
the View Test Log window opens automatically, listing all tests performed and showing details
of which tests passed or failed, as shown in the example in
.
NOTE:
The Full System Monitoring Test has five sub-tests (Fixed Voltages, Temperatures, Fans
Speed, Battery Parameters, and Tx Voltages). These are listed in the Test column, as shown
in
8.) Select the first report (Fixed Voltages); the report is highlighted in the
Reports
list, and the
corresponding results are shown in the Report window below, as shown in
Figure 7-58 View Test Log - Full System Monitoring Test


