


Showing a Navigation Inset
You can control whether a navigation inset appears on some
chart views. The navigation inset is shown only when the boat is
navigating to a destination.
1
From a chart or 3D chart view, select
MENU
.
2
If necessary, select
Chart Setup
.
3
Select
Overlay Numbers
>
Nav. Inset
>
Auto
.
4
Select
Navigation Inset Setup
.
5
Complete an action:
• To show waypoint velocity made good (VMG) when
navigating a route with more than one leg, select
Route
Leg Info
>
On
.
• To show next-turn data based on distance, select
Next
Turn
>
Distance
.
• To show next-turn data based on time, select
Next Turn
>
Time
.
• To indicate how the destination data appears, select
Destination
, and select an option.
Other Vessels Settings on the Charts and Chart Views
NOTE:
These options require connected accessories, such as
an AIS receiver or VHF radio.
From a chart or 3D chart view, select
MENU
>
Other Vessels
.
AIS List
: Shows the AIS list (
).
DSC List
: Shows the DSC list (
).
AIS Display Setup
: See
DSC Trails
: Shows the tracks of DSC vessels, and selects the
length of the track that appears using a trail.
AIS Alarm
: Sets the safe-zone collision alarm (
).
AIS Display Settings
NOTE:
AIS requires the use of an external AIS device and
active transponder signals from other vessels.
From a chart or 3D chart view, select
MENU
>
Other Vessels
>
AIS Display Setup
.
AIS Dis. Range
: Indicates the distance from your location within
which AIS vessels appear.
Details
: Shows details about AIS-activated vessels.
Proj. Heading
: Sets the projected heading time for AIS-
activated vessels.
Trails
: Shows the tracks of AIS vessels, and select the length of
the track that appears using a trail.
Fish Eye 3D Settings
NOTE:
This feature is available with premium charts, in some
areas.
From the Fish Eye 3D chart view, select MENU.
View
: Sets the perspective of the 3D chart view.
Tracks
: Shows tracks.
Sonar Cone
: Shows a cone that indicates the area covered by
the transducer.
Fish Symbols
: Shows suspended targets.
Overlay Numbers Settings
From a chart, 3D chart view, the Radar screen, or a
Combinations screen, select
MENU
>
Overlay Numbers
.
From a chart, 3D chart view, or a Combinations screen, select
MENU
>
Overlay Numbers
.
Edit Layout
: Sets the layout of the data overlay, or data fields.
You can select the data to be shown within each data field.
Nav. Inset
: Shows the navigation inset when the vessel is
navigating to a destination.
Navigation Inset Setup
: Allows you to configure the navigation
inset to show Route Leg Info, and to control when the inset
appears before a turn or destination.
Compass Tape
: Shows the compass tape data bar when the
vessel is navigating to a destination.
Editing the Data Fields
You can change the data shown in the overlay numbers
displayed on the charts and other screens.
1
From a screen that supports overlay numbers, select
MENU
.
2
If necessary, select
Chart Setup
.
3
Select
Overlay Numbers
>
Edit Layout
.
4
Select a layout.
5
Select a data field.
6
Select the type of data shown in the field.
Available data options vary based on the chartplotter.
Garmin Quickdraw
™
Contours
Mapping
WARNING
The Garmin Quickdraw Contours mapping feature allows users
to generate maps. Garmin makes no representations about the
accuracy, reliability, completeness or timeliness of the maps
generated by third parties. Any use or reliance on the maps
generated by third parties is at your own risk.
The Garmin Quickdraw Contours mapping feature allows you to
instantly create maps with contours and depth labels for any
body of water.
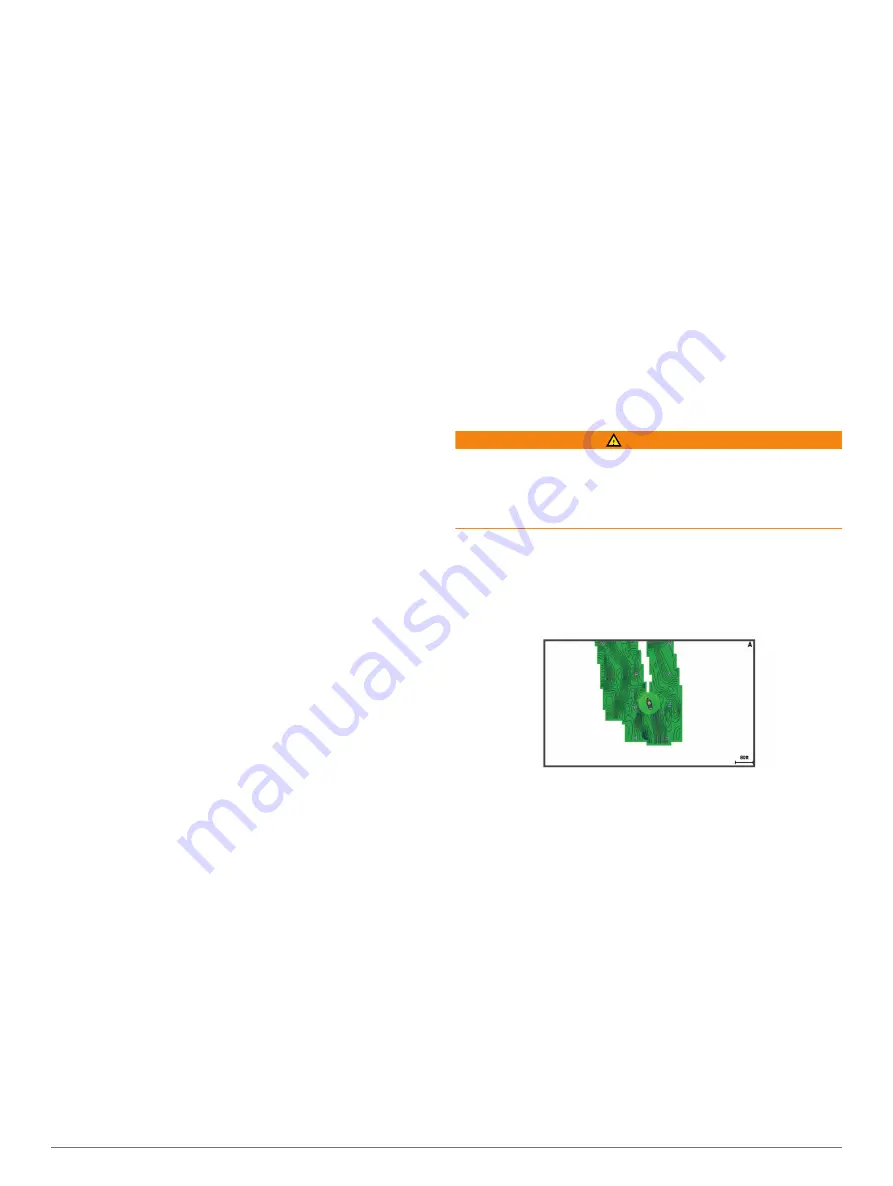
When Garmin Quickdraw Contours records data, a colored
circle surrounds the vessel icon. This circle represents the
approximate area of the map that is scanned by each pass.
A green circle indicates good depth and GPS position, and a
speed under 10 mph. A yellow circle indicates good depth and
GPS position, and a speed between 10 and 20 mph. A red circle
indicates poor depth or GPS position, and a speed above 20
mph.
You can view Garmin Quickdraw Contours in a combination
screen or as a single view on the map.
The amount of saved data depends on the size of your memory
card, your sonar source, and the speed of your boat as you
record data. You can record longer when you use a single-beam
sonar. It is estimated that you might be able to record about
1,500 hours of data onto a 2 GB memory card.
When you record data on a memory card in your chartplotter,
the new data is added to your existing Garmin Quickdraw
Contours map, and is saved on the memory card. When you
insert a new memory card, the existing data does not transfer
onto the new card.
8
Garmin Quickdraw
™
Contours Mapping


