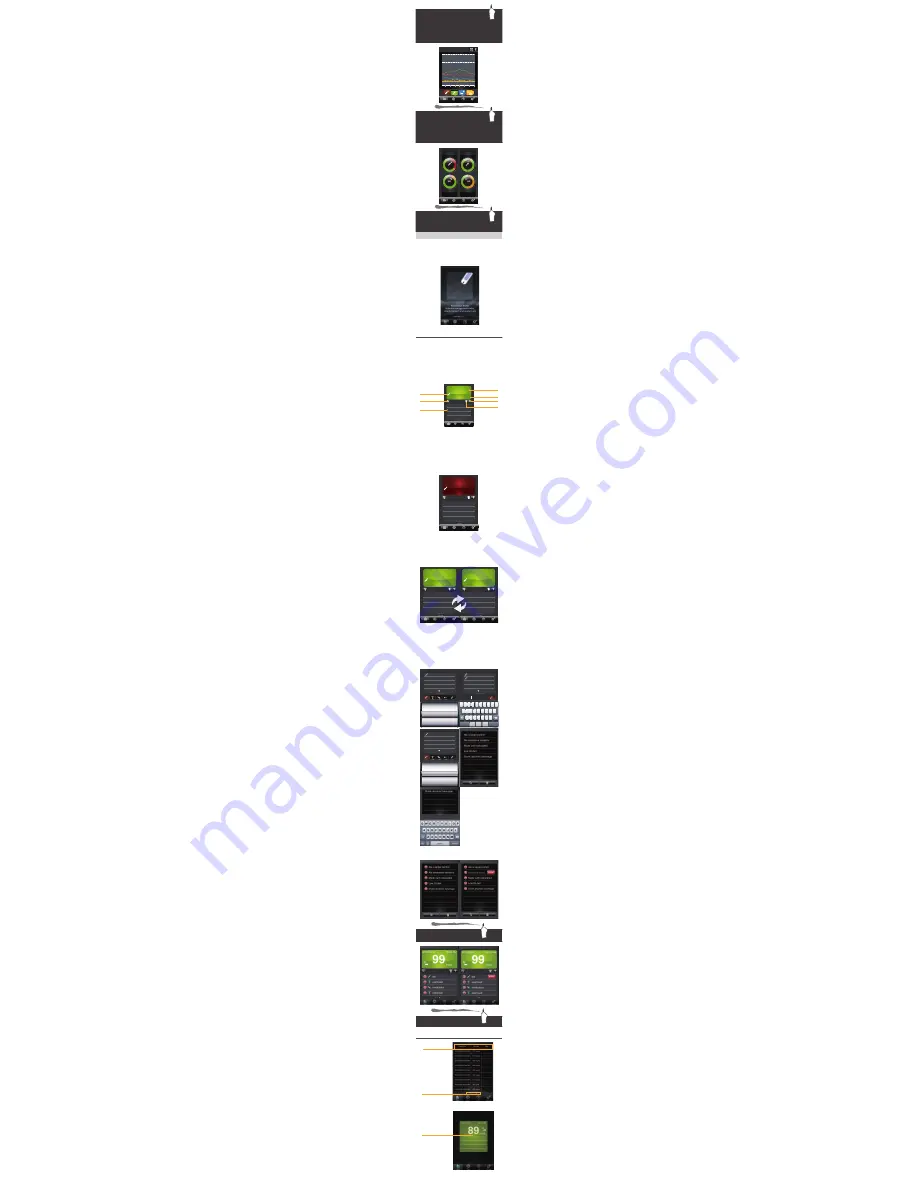
If using the meter for the first time, a message
will appear reminding the user to connect the
device with the application to start recording. You
will be limited to see only the reminding message
until a test has been taken.
The meter stores the blood glucose test results
along with respective dates and times in memory
under iPhone. To review the data in the iPhone,
press Data on the main menu bar, next you can
select the desired function by tapping the icon on
the Floating Menu, or alternatively by swiping
upwards for different functions.
1.Select the Data Record mode from the Main
Menu Bar.
Select Data in the main menu bar to enter. The
first reading you see is the last blood glucose
result along with the reading, date, time and the
measurement mode.
An example:
(199 mg/dL = 11.1mmol/L)
2.Swipe left or right to recall the individual
test results stored in the memory.
An example:
(98 mg/dL = 5.4 mmol/L)
3. Note by Category
3-1 Add Notes:
You can select different categories or type in
personal note to add new ones for that individual
measurement. You also can add new one as a
frequent-used canned message for adding notes
more convenient.
3-2 Delete Notes:
You also can delete the note if needed.
DATA
Reviewing Data Record
Data Record Screen
Logbook—by swiping left or right of
the log you can switch between
current 7 days of glucose testing
data to the previous weekly log
records.
Swipe up to see the next function- Trend Graph
Trend Graph—select the enlarge button
on the top right corner to switch between
7-14-30days view.
To see different times, simply slide to the
left or right.
Swipe up to see the next function- Pie Chart
By swiping to the left or right you can
switch between the glucose control ratio
pie charts of current 7days, 14 days and 30
days under 4 measuring modes.
Low
7 %
Normal
60 %
high
33 %
14 Days
AC
PC
AM
PM
Low
8 %
Normal
90 %
high
12 %
Low
11 %
Normal
84 %
high
5 %
Low
36 %
Normal
48 %
high
16 %
Data
Plan
FAQ’s
Settings
2011/12/25 AM 09:15
mg/dL
112
Data
Plan
FAQ’s
Settings
2011/12/25 AM 09:15
mg/dL
98
Data
Plan
FAQ’s
Settings
2011/12/25 AM 09:15
mg/dL
119
Data
Plan
FAQ’s
Settings
Data
Plan
FAQ’s
Settings
Blood Glucose
Test Result Result
Symbol indication
of
AC – PC
AM - PM
To add notes
Note displays
Blood glucose
unit
Help
Delete notes
Data
Trends
Plan
FAQ’s
Settings
1
Ate fatty food
ggggg
ppp
Data
Trends
Plan
FAQ’s
Settings
Q
Q
W
W
E
E
R
R
T
T
Y
Y
U
U
I
I
O
O
A
A
S
S
D
D
F
F
G
G
H
H
J
J
Z
Z
X
X
space
space
@
@
.
.
return
return
.?123
.?123
C
C
V
V
B
B
N
N
M
M
K
K
L
L
P
P
Ate excessive desserts
Ate excessive desserts
Mede carb calculated
Mede carb calculated
Drank alcohol
Drank alcohol
Ate a larger portion
Ate a larger portion
Ate excessive desserts
Add New...
Add New...
qrtsett
qrtsett
pop
pop
Ate excessive desserts
(b) In data record page
(a) In canned message
management page
Reviewing Record List
Record Titles
Page Indications
Enlarge to see each
entry in detail
12/23
12/24
12/24
12/25
12/26
12/27
12/29
12/31
01/02
01/04
12/28
12/30
01/01
01/03
30 Days
0
60
120
180
240
300
360
420
540
0
60
120
180
240
300
360
420
540
Data
Plan
FAQ’s
Settings
2011/12/25 AM 09:15
mmol/L
5.4


