background image

  QS301034  Rev. C 


7   

|


1)


Press 

MENU

 to access the Setup screen. 


2)


Press 

ACK

 to access the dEc PT screen. 


3)


Press 

Up Arrow / Max

 to access the unitS screen. Then, press 

ACK


4)


This screen allows you to set a three-digit representation of the units of 
measure that will be displayed on the secondary display. Press 

Right 

Arrow / Reset

 to move the highlighted digit to the right and 

Up Arrow / 

Max

 button to change the digit until it spells the unit. 


5)


When your unit of measure is displayed, press 

ACK

 to save the setting. 


6)


Press 

MENU

 to exit the Setup screen. 


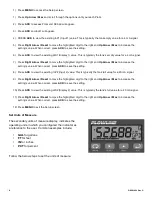
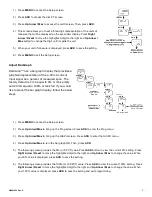
Adjust Bar Graph


DataLoop™ has a bar graph display that provides a 
graphical representation of the 4-20 mA current 
input signal as a percent of measured span.  The 
factory default is 4 mA equal to 0% or tank empty 
and 20 mA equal to 100% or tank full. If you would 
like to adjust the bar graph display, follow the below 
steps. 


1)


Press 

MENU

 to access the Setup screen. 


2)


Press 

Up Arrow/Max

 to bring up the Prog screen. Press 

ACK

 to enter the Prog menu. 


3)


Press 

Up Arrow/Max

 to bring up the GrAPH screen. Press 

ACK

 to enter the GrAPH menu. 


4)


Press 

Up Arrow/Max

 to turn the bar graph ON. Then, press 

ACK


5)


The following screen provides the 0% (or 0 PCT) value. Press 

ACK

 button to view the current 0% setting. Press 

Right Arrow / Reset

 to move the highlighted digit to the right and 

Up Arrow / Max

 to change the value. When 

your 0% value is displayed, press 

ACK

 to save the setting. 


6)


The following screen provides the 100% (or 100 PCT) value. Press 

ACK

 to view the current 100% setting. Press 

Right Arrow / Reset

 to move the highlighted digit to the right and 

Up Arrow / Max

 to change the value. When 

your 100% value is displayed, press 

ACK

 to save the setting and exit programming. 


Summary of Contents for Data loop

Page 1: ...10500 Humbolt Street Los Alamitos CA 90720 p 562 598 3015 f 562 431 8507 w flowline com QS301034 Rev C 2016 Flowline Inc All Rights Reserved Made in USA DataLoop Level Indicator LI25 1 LI25 2 Series...

Page 2: ...l indicator must be installed in accordance with Control Drawing LIM688FL 2 AX01 06 08 located on pages 8 9 of this Quick Start If you have a LI25 2001 follow those instructions first and then return...

Page 3: ...g LIM688FL 2 AX01 06 08 located on pages 8 9 of this Quick Start If you have a LI25 2001 follow those instructions first and then return to the USING DATALOOP section of this Quick Start Signa DataLoo...

Page 4: ...CK is pressed Entering the Menu To enter the menu press the MENU button With the UP arrow you can scroll through the three menu options including Setup Program and Password Setup Selects the Decimal P...

Page 5: ...decPT screen 3 Press ACK and the decimal point display screen will appear as dd ddd This screen allows you to set the decimal point in your display Press Right Arrow Reset to move the decimal point on...

Page 6: ...When correct press ACK to save the setting 8 Press ACK to view the existing InP2 Input 2 value This is typically the tank full value for a 20 mA signal 9 Press Right Arrow Reset to move the highlight...

Page 7: ...ank empty and 20 mA equal to 100 or tank full If you would like to adjust the bar graph display follow the below steps 1 Press MENU to access the Setup screen 2 Press Up Arrow Max to bring up the Prog...

Page 8: ...8 QS301034 Rev C M LI25 2001 INTRINSIC SAFETY CONTROL DRAWING LIM688FL 2 AX01 06 08...

Page 9: ...QS301034 Rev C 9 LI25 2001 INTRINSIC SAFETY CONTROL DRAWING LIM688FL 2 AX01 06 08...

Page 10: ...tlined above 2 have been subjected to electrical mechanical or chemical damage due to improper accidental or negligent use 3 have been modified or altered 4 anyone other than service personnel authori...

Reviews: