Field Controls 4291UV-AIR Test Instructions Download Page 3


Page 3

Background 

This product study evaluates the effectiveness of the UV-Aire air purifier in reducing the 
levels of bacteria with a single pass through a simulated air duct system.  This device is 
designed to irradiate the air as it circulates through the home, so the single pass 
evaluation is the worst-case scenario use of this device. The air in the home will pass 
through the heating and air conditioning system many times a day, as the air is 
circulated throughout the home.  Knowing the effectiveness of the UV-Aire in a single 
pass application, enables us to project how effectively the device will treat the air with 
multiple passes a day. 

UV light technology has been successfully used for the disinfection of drinking water for 
years. Applications for air disinfection with the use of UV light technology include: 
commercial air treatment in hospitals, clean rooms, meat packing plants, bakeries, 
dairies, breweries, bottling plants and large commercial HVAC systems. 
 
O

RGANISM

:


Serratia marcescens

 (ATCC 14756) was chosen as the test bacterium.  The distinctive 

red colonies made it easy to evaluate from any background organisms.  A raw test 
suspension of the organism of approximately 95,000 CFU/ml was used.  As dispersed 
into the test system, this suspension yielded bacterial counts of 269 CFU/ft

3

 @ 500 ft/min 

airflow and 107.5 CFU/ft

3

 @ 1000 ft/min airflow. (CFU = Colony Forming Units)  

 
T

ESTING 

S

TRUCTURE

:


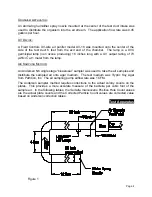
An 18” x 18” galvanized air duct, 38 feet long was constructed as the test chamber (see 
Figure 1).  A fan was mounted at the exit end of the chamber and the treated air 
exhausted to the outdoors.  To reduce contamination of the intake air, all air intakes on 
the exhaust side of the building were sealed.  The exhaust fan was equipped with a flow 
adjustment to allow for adjustable air speeds measured in feet per minute (FPM) through 
the duct.   
 
T

ESTING 

A

IRFLOW 

R

ATE

:


The airflow rate through the ductwork was adjusted to two nominal velocities of 500 ft/min 
and 1000 ft/min.  The airflow velocities were measured at the center of the duct at the 
intake end of the test duct. 
 

Summary of Contents for 4291UV-AIR

Page 1: ...al Assays Sanitary Environmental Microbiology Bernard E Kane Ph D 1706 Canterbury Rd Greenville NC 27858 Ph 252 355 6789 Oysterdoctor aol com Efficiency Of Bacterial Disinfection By A Duct Mounted UV Aire Air Purifier For ...

Page 2: ...Testing Structure 3 Testing Airflow Rate 3 Organism Applicator 4 UV Device 4 Air Sampling Method 4 Test Apparatus 4 Testing Procedure 5 Tables 6 7 Table 1 Control Data 6 Table 2 UV 18 Test Data Results 6 Table 3 UV 18X Test Data Results 7 Conclusion 8 ...

Page 3: ...g plants and large commercial HVAC systems ORGANISM Serratia marcescens ATCC 14756 was chosen as the test bacterium The distinctive red colonies made it easy to evaluate from any background organisms A raw test suspension of the organism of approximately 95 000 CFU ml was used As dispersed into the test system this suspension yielded bacterial counts of 269 CFU ft3 500 ft min airflow and 107 5 CFU...

Page 4: ... cm2 at 1 meter from the lamp AIR SAMPLING METHOD An Andersen N6 single stage bioaerosal sampler was used to take the air samples and distribute the sampled air onto agar medium The test medium was Tryptic Soy Agar from PathCon Inc The air sampling pump airflow rate was 1 CFM The Anderson sampler method requires corrections to the actual colony counts on the plates This provides a more accurate me...

Page 5: ... through the spray nozzle mounted in the center of the duct inlet Five air samples were taken for each of the test velocities at short intervals typically to 2 minutes This produced a large sample volume of air and reduced the levels of back ground bacteria and molds counts The plate counts colony forming units or CFU for each of the five tests were totaled and divided by the total test volume of ...

Page 6: ... 1000 92 103 Total min 8 Total Corrected Particle counts 860 107 50 Table 2 UV 18 Test data and results testing with lamp on Sample Number Air Sampling Duration min Airflow Velocity fpm Serratia marcescens Positive hole count Corrected Particle Counts CFU FT 3 of air count min Survival CFU Control Log Reduction Effective 1 1 1000 30 31 2 1 1000 32 33 3 3 1000 88 99 4 6 1000 145 180 Total min 11 To...

Page 7: ...article Counts CFU FT 3 of air count min Survival CFU Control Log Reduction Effective 1 2 5 1000 21 22 2 2 5 1000 27 28 3 2 5 1000 28 29 4 5 1000 48 51 Total min 12 5 Total Corrected Particle Counts 130 10 40 9 67 1 01 90 33 Control 107 50 1 5 500 8 8 2 5 500 10 10 3 5 500 17 17 4 10 500 28 29 Total min 25 Total Corrected Particle Counts 64 2 56 0 95 2 02 99 05 Control 269 00 ...

Page 8: ...ergy level At the higher velocity the lamp still reduced the bacterial levels by at least 71 at a 50 decrease in the exposure time Since the reduction efficiency is based on lamp UV output and exposure time the assumption can be made that decreasing the exposure time to the UV light is similar to testing an organism that requires a higher UV energy requirement to kill the bacteria The log reductio...

Reviews: