


Lightmeter LM10
7.9. Cutting down datasets
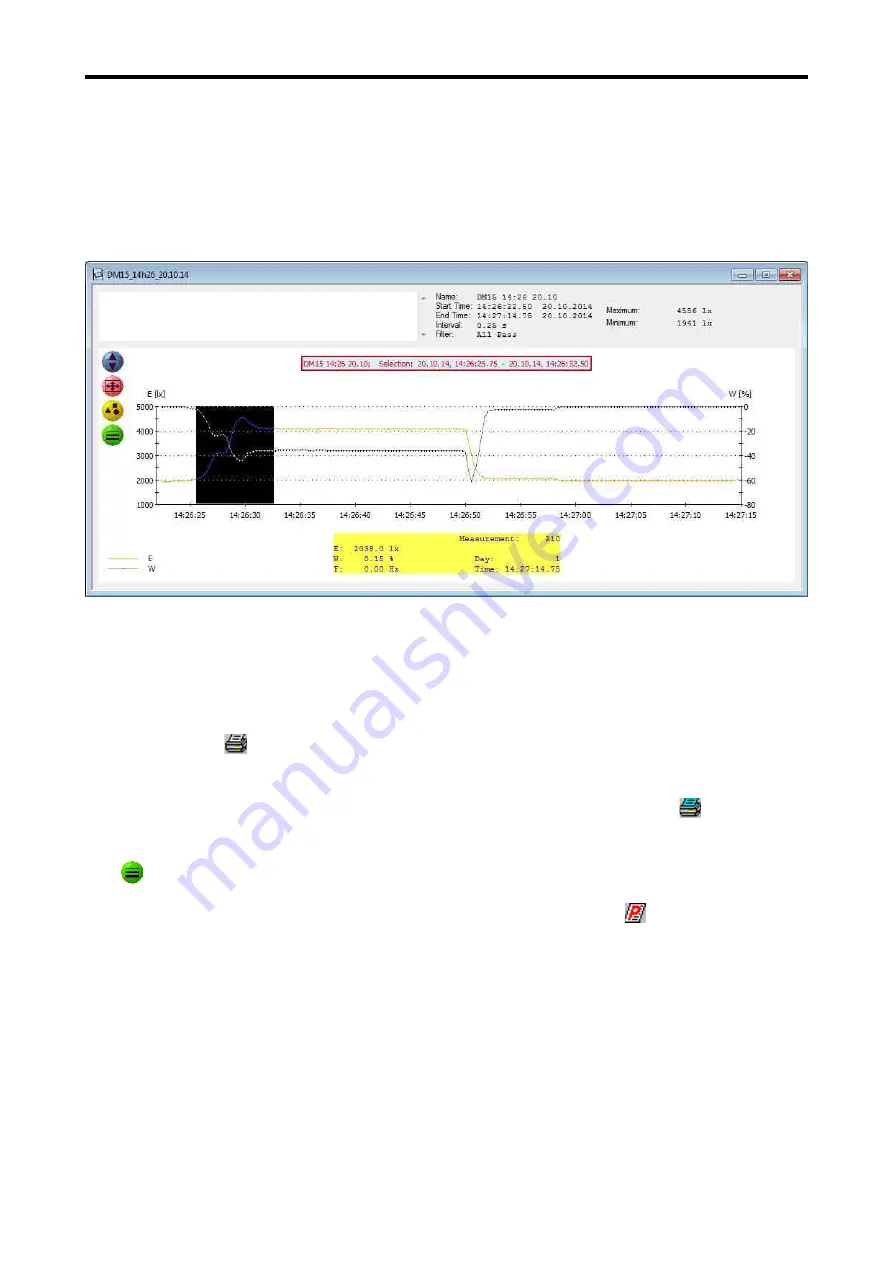
Using the
Edit/Crop
function a time frame of a data set can be cut and saved.
To do this, the time frame to be cut is marked by keeping the left mouse button pressed, the start
and end time of the marked frame is displayed using the diagram in red bordered window.
Subsequently, cut the time frame using the
Edit/Crop
function and save the dataset under a
changed name.
7.10. Print and Export
The graph and the information about the dataset can be printed with comments in order to gene-
rate a measurement protocol.
The printing of a measurement diagram is achieved using the menu point
File/Print Graphic
or with
a click on the icon . Here, it is recommended to zoom the graphic window to its maximum size
and choose the printer setting lateral before printing.
If the records are very large, some printer drivers may yield incomplete printouts. The graph is
printed as screenshot via the File/Print Bitmap menu option or via the icon . This always
creates a correct printout, though the quality depends on the screen resolution.
If the lines in the diagram are very thin on the printed paper, you can vary the line width the
icon .
A protocol showing the most important information about the dataset and the text of the comment
are printed using the menu point
File/Print Protocol
or clicking on the icon .
If you want to edit the measured values with another programme, they can be exported with the
function
File/Export Text File
.
The measurement diagram can be displayed as a BMP image file using the function
File/Export
Bitmap
. Alternatively, it can be copied to the clipboard with the
File/Copy To Clipboard
function.
27


