SMP 111 • Web-Based User Interface
57
Troubleshooting
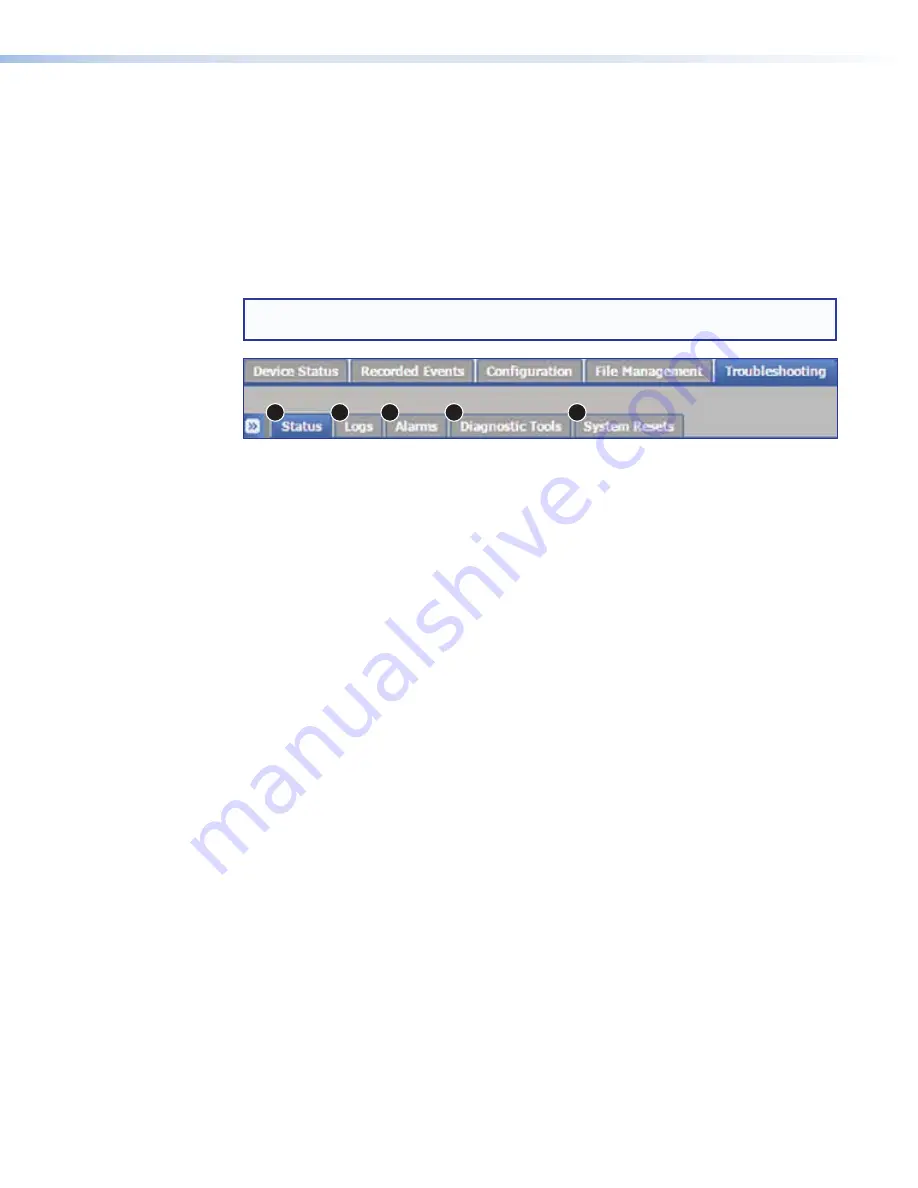
The five pages within the
Troubleshooting
tab contain controls typically used during
initial setup to test connections, and then later if a product support issue arises. They make
it possible for an administrator to:
•
View current system conditions and connections.
•
View event logs and alarms.
•
Test network connections.
•
Reset the unit.
NOTE:
Only administrators have access to the
Troubleshooting
tab and can see
and make changes to all settings.
1
2
3
4
5
Figure 52.
Troubleshooting Tab and Subtabs
The pages within
Troubleshooting
include:
1
Status
— Displays information about the firmware and web page versions, system
and component temperatures, Ethernet connection, MAC address, date and time,
as well as details about the bit rates for audio and both the recording and streaming
encoder streams (see
on the next page for more information).
2
Logs
— Displays a list (log) of alerts and notices for any event set up for any status
other than
Disabled
in
Configuration
>
Alarms
and
Traps
>
Alarm
Message
List
. The log can be sorted by date and time, priority, DB ID, or message. It can also
be filtered, or exported to a CSV file (see
on page 59 for more information).
3
Alarms
— Similar to Logs, this page displays a list of the more severe events that
trigger alarms. The list can be sorted, filtered, or exported to a CSV file. Individual
alarms can be cleared. Only active and recently active alarms are displayed (see
on page 60 for more information).
4
Diagnostic
Tools
— Provides a convenient way to test network connections
using a ping utility, a route (tracert) function, or Nmap test. It also includes a feature to
run other diagnostic tests that generate a debugging log (see
page 61 for more information).
5
System
Resets
— Allows the user to initiate a unit reboot, delete all stored content
and format the internal storage, or perform one of five different types of reset (see
on page 62 for more information).
figure 52


