163
2121331-04-04/19 (Translation of the original operating instructions)
Operating Instructions
Modular Safety Control System MSC
EN
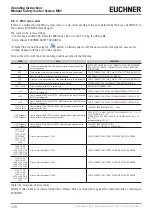
9.6.2. Administration of the graphic simulation
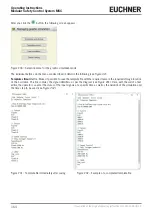
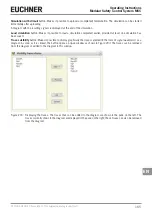
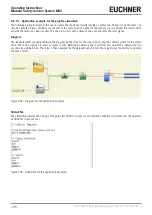
Activate the graphic simulation by clicking the
button.
The graphic simulation makes it possible to show the change in the signals graphically. The user must first specify in a text
file the stimuli, i.e. the waveforms over time, that are used as inputs (stimuli). The simulator converts the stimuli file prepared
into a diagram and displays the required traces at the end of the simulation.
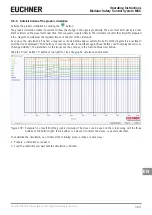
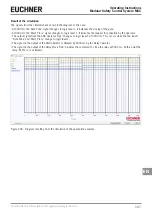
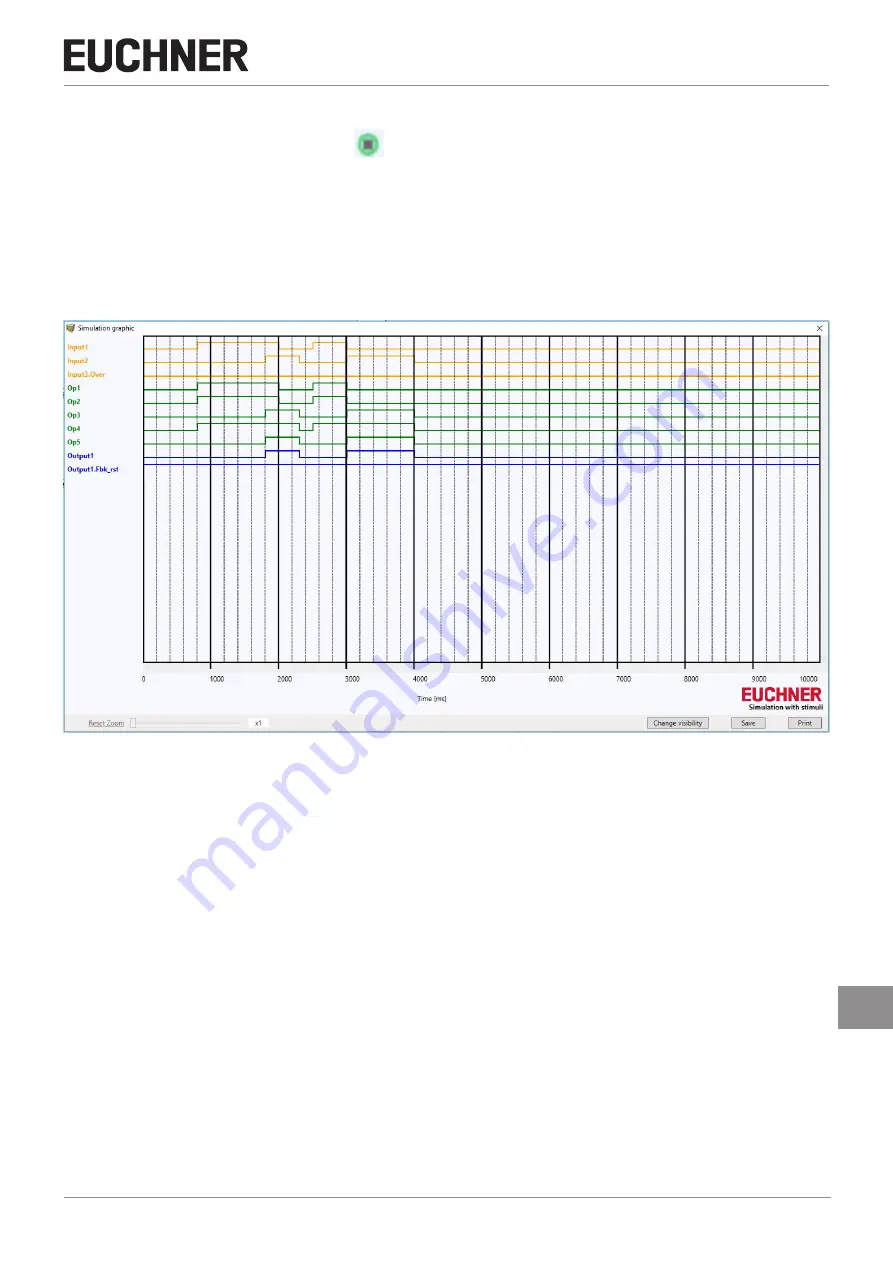
As soon as the simulation is finished, a diagram as shown below appears automatically. From the diagram it is possible to
print the traces displayed ("Print" button), to save the results, to load them again ("Save" button), and to display other traces
("Change visibility"). The identifiers for the traces are the same as in the function block description.
Click the "Close" button ("X" button at top right) to close the graphic simulation environment.
Figure 199: Example for a result from the graphic simulation: The traces can be seen on the screen along with the three
buttons at the bottom right; these buttons can be used to select the traces, save and print them.
To undertake the simulation, as a minimum the following process steps are necessary:
1. Prepare a stimuli file as required
2. Load the stimuli file and wait until the simulation is finished
Summary of Contents for MSC
Page 1: ...EN Operating Instructions Installation and use Modular Safety Control System MSC ...
Page 171: ......
Page 173: ......


