46
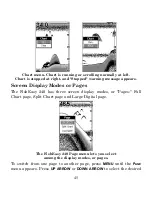
page. (The screen changes as you move through the menu.) When the
page you want is selected, press
PWR
to clear the menu.
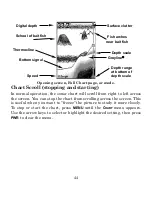
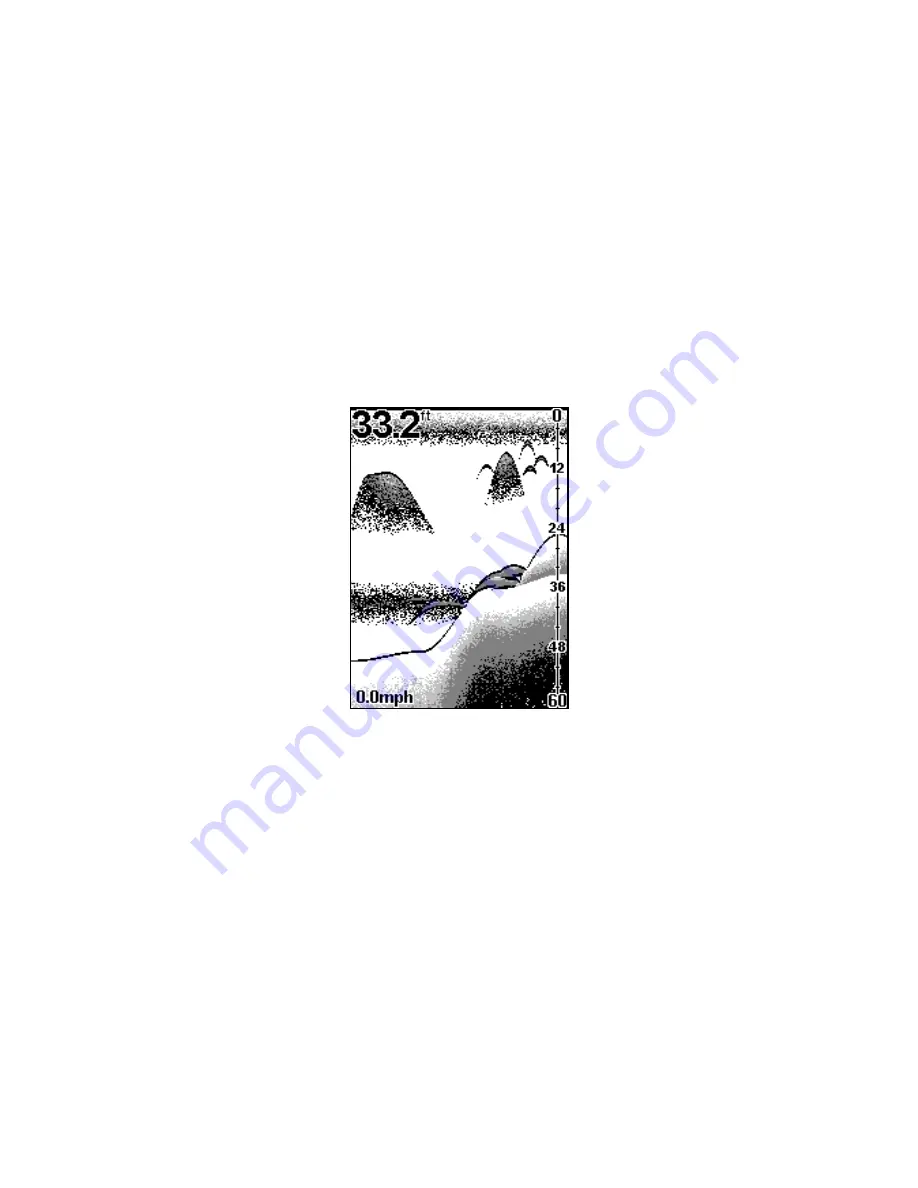
Full Chart
This shows all echoes scrolling across the full screen. This is the default
page. The bottom signal scrolls across the screen from right to left.
Depth scales on the right side of the screen make it easy to determine
the depth of fish, structure, and other targets. The line at the top of the
screen represents the surface. The bottom depth (as determined by the
digital sonar) shows in the upper left corner.
Full Chart page, showing digital depth at top and speed at bottom.
If an optional speed or temperature sensor is connected, digital dis-
plays for speed and/or temperature will also be shown.
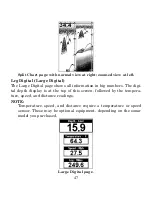
Split Chart
This shows the normal view of the underwater world from the surface
to the bottom on the right side of the screen. The left side shows an
enlarged or "zoomed" version of the echoes appearing on the right side.
A zoom message, such as "2X," appears at the bottom of the "zoomed"
side of the screen.
Summary of Contents for FishEasy 240 Portable
Page 6: ...iv Notes ...

