dimtel
dimtel
5.3
Display Panels
5.3.7
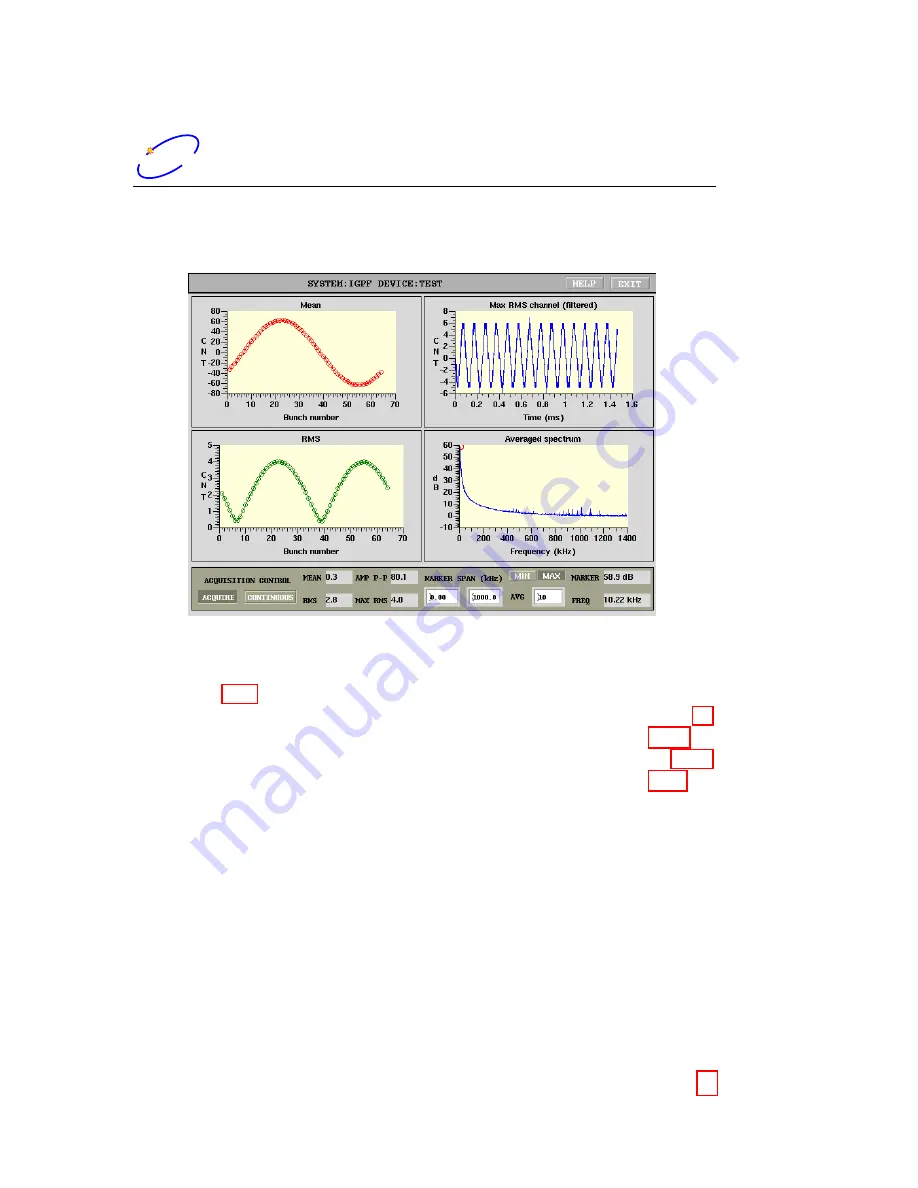
Waveforms Panel
Figure 11: Waveforms panel
A set of IOC subroutines postprocesses the data in the real-time and pro-
vides four concise plots displayed in the waveform panel shown in Figure 11.
The four plots are: bunch-by-bunch mean and root mean square (RMS) of
bunch oscillations, time-domain signal of a bunch with the largest RMS.
The last plot is obtained by performing the fast Fourier transform (FFT) on
each of the bunches and quadratically averaging the resulting spectra. This
plot aliases all coupled-bunch eigenmodes to a frequency span from DC to
ω
rev
/
2. Such a spectrum allows the operator to very quickly check how well
the system damps the coupled-bunch motion.
DATA ACQUISITION CONTROL ON/OFF
Data acquisition enable.
Turn this control to on to acquire and postprocess the data.
CONTINUOUS/SINGLE
Selects between single acquisition mode and
continuous updates.
MEAN
Overall mean of the data.
27 of 58


