Clinical Studies
A-22
Operator’s Manual
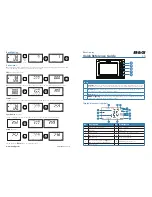
Figure A-18.
Correlation Plot for Pulse Rate (All Data - No Motion): ECG HR vs. Pulse Rate
Pulse oximeters have been known to perform better at the higher saturation levels
compared to the lower end. Though, when presenting the A
RMS
, the common
methodology is to provide the data across the whole range (70% to 100%). The data
below is presented to show each decade, which includes the RMSD (root mean
square difference) and N values. RMSD and A
RMS
are the same. A
RMS
is used for
pooled data across the whole study to represent accuracy of the system, whereas
RMSD is used as the general term. There is no acceptance criteria associated with
decade levels of hypoxia, thus represented as RMSD. In Table A-3, SpO
2
RMSD is pre-
sented per decade.
1
Pulse Rate (BPM)
2
ECG HR (BPM)
Table A-3.
RMSD of SpO
2
per Decade (No Motion)
SpO
2
Range
100%-90%
89%-80%
79%-70%
N
1693
1037
1212
RMSD (%)
1.46
1.66
2.01
Summary of Contents for Nellcor Series
Page 1: ...Operator s Manual Nellcor Bedside SpO2 Patient Monitoring System TM...
Page 8: ...Page Left Intentionally Blank vi...
Page 12: ...Page Left Intentionally Blank x...
Page 20: ...Introduction Page Left Intentionally Blank 1 8 Operator s Manual...
Page 36: ...Installation Page Left Intentionally Blank 3 8 Operator s Manual...
Page 118: ...Product Specifications Page Left Intentionally Blank 11 18 Operator s Manual...
Page 156: ...Clinical Studies Page Left Intentionally Blank A 38 Operator s Manual...
Page 159: ......