3-2
User Generated Graphs
Built-in function graphs can aiso be used in combination with each other. Graph-
ing a formula such as.y = 2 x
2
+ 3 ;t- 5 makes it possible to visually represent the
solution.
Unlike built-in functions, the ranges of user generated graphs are not set auto
matically, so graphs produced outside of the display range do not appear on the
display.
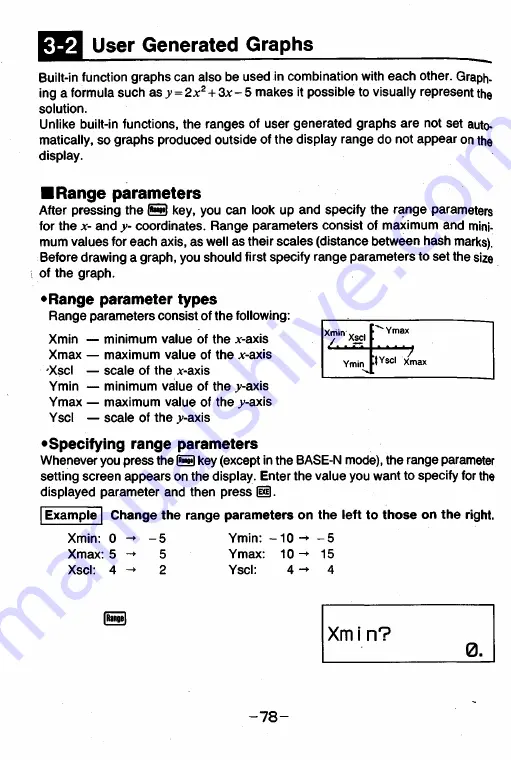
■Range parameters
After pressing the S key, you can look up and specify the range parameters
for the
x
- and
y
- coordinates. Range parameters consist of maximum and mini
mum values for each axis, as well as their scales (distance between hash marks).
Before drawing a graph, you should first specify range parameters to set the size
of the graph.
•Range parameter types
Range parameters consist of the following:
Xmin — minimum value of the x-axis
Xmax — maximum value of the x-axis
OCscI — scale of the *-axis
Ymin — minimum value of the .y-axis
Ymax — maximum value of the .y-axis
Yscl — scale of the .y-axis
•Specifying range parameters
Whenever you press the S key (except in the BASE-N mode), the range parameter
setting screen appears on the display. Enter the value you want to specify for the
displayed parameter and then press (iD.
Xy ' n XSCl
Ymax
Ymin
it Yscl xmax
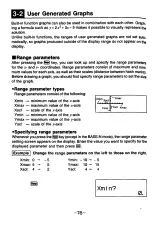
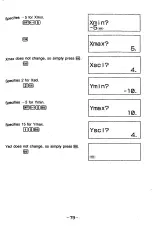
Example Change the range parameters on the left to those on the right.
Xmin: 0
- 5
Ymin:
- 1 0
-
- 5
Xmax: 5 -►
5
Ymax:
1 0
-
15
Xscl: 4 -►
2
Yscl:
4 -
4
|Range|
Xmi n?
0.
- 7 8 -
Summary of Contents for FX-6300G
Page 1: ...CASIO SA0911C Printed in Taiwan U S Pat 4 410 956 HDC00380E1 W30 ...
Page 2: ...GRAPHIC SCIENTIFIC F X 6300G O w n e r s manual ...
Page 4: ...graphic sc ien tific fx 6300G ...
Page 152: ... 1 5 4 ...
Page 157: ... program for No Step Key operation Display 1 5 9 ...
Page 167: ... 1 7 0 ...
Page 168: ...Function Reference Error Message Table Input Ranges of Functions Specifications ...


