


12
Java-enabled web browser. See “CONTROLLER SETTINGS”
on page 42 for configuration instructions.
The minimum browser configuration includes:
• Microsoft Internet Explorer (version 8 or higher) or Mozilla
Firefox (version 3.5.2 or higher). In the advanced connection
options, add the unit address to the address list. Do not use a
proxy server.
• Java platform (version 6 or higher). In the control panel,
deselect (uncheck) the option that allows storing tempo-
rary internet files and use a direct connection.
To access the PIC6 user interface, enter the IP address of the
unit in the address bar of the web browser. The IP address can
be viewed or changed from the PIC6 interface. For more infor-
mation on the web browser and Java platform configuration,
see the Diagnostics and Troubleshooting section.
General Interface Features
ICONS
Table 9 shows general interface icons.
Table 9 — Interface Icons
SCREENS
The Human Machine Interface includes the following screens:
• Home screen, which displays the main parameters
• Menu screens for navigation
• Data/configuration screens, which list the parameters by type
• Operating mode selection screen
• Password entry and language selection screen
• Parameter modification screen
• Time schedule screen
If the interface is not used for a long period, it goes into screen-
saver mode and displays a black screen. However, the control
is always active and the unit operating mode remains un-
changed. When the user presses the black screen, the Home
screen is displayed.
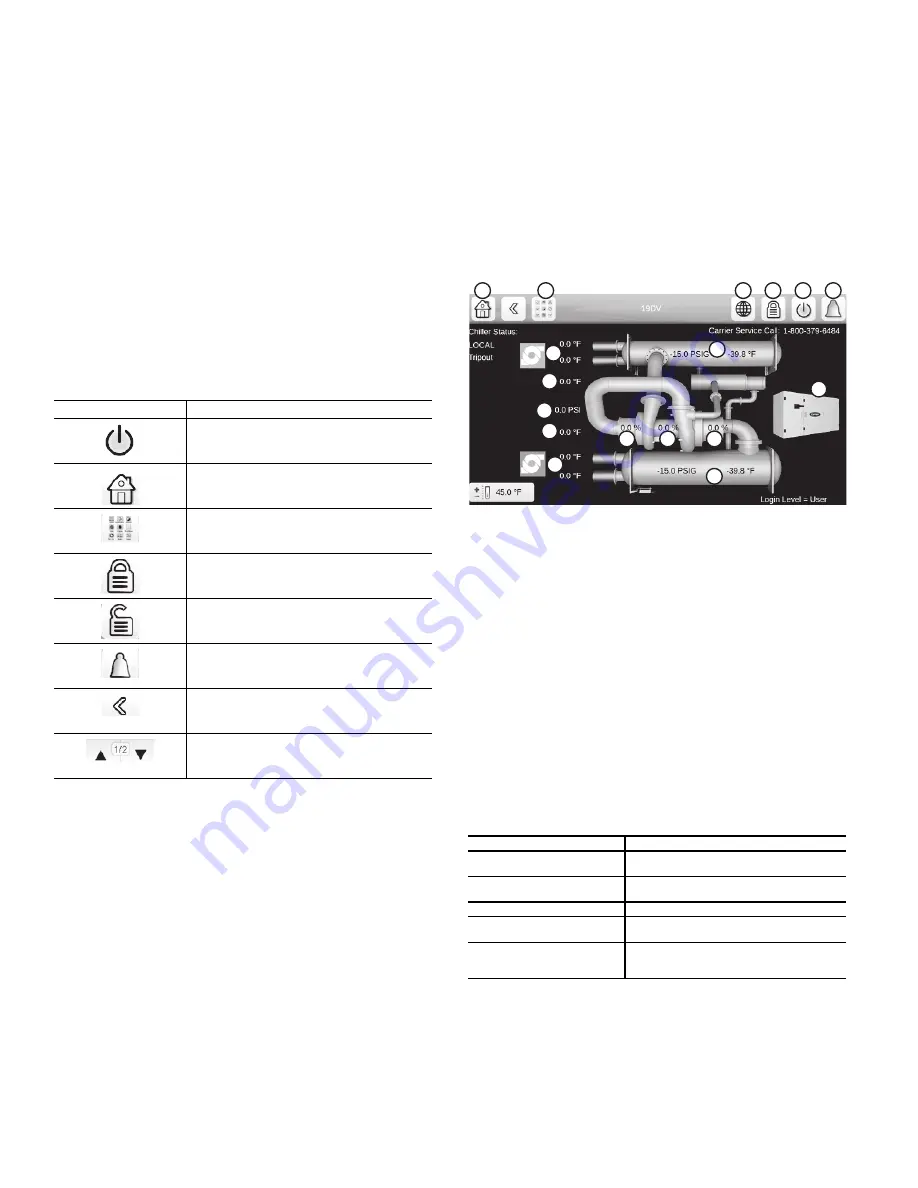
System Overview (Home) Screen
Figure 10 shows the system overview screen. Press a compo-
nent image to see current status. For details, see Status Display
Messages
The Set Point screen, On/Off screen, User Login screen, and
Main Menu screens described in the next sections may display
status messages at the bottom of the screen. See Table 10.
Fig. 10 — System Overview (Home) Screen
Table 10 — Status Messages
ICON
MEANING
Green: Indicates unit is running
Gray: Indicates unit is off
Home
Main menu
Indicates user is logged off
Indicates user is logged in
Gray: Indicates no alarm or alert is active
Red: Indicates alarm or alert
Back (not visible in main menu)
Previous and next screen
MESSAGE
STATUS
COMMUNICATION FAILURE!
Equipment controller did not respond while
reading the table content.
ACCESS DENIED!
Equipment controller does not allow access to
one of the table data blocks.
LIMIT EXCEEDED!
The value entered exceeds the table limits.
Save changes?
Modifications have been made. The interface
waits to confirm exit; press Save or Cancel.
HIGHER FORCE IN EFFECT!
Equipment controller rejected a Force or Auto
command because the interface force level is
lower than that of the equipment controller.
LEGEND
1
—
Home Screen Access Button
2
—
Main Menu Access Button
3
—
Globe Button
4
—
User Login Screen Access Button
5
—
Unit Start/Stop Access Button
6
—
Alarm Menu Access Button
7
—
Condenser Saturated Pressure and Temperature
8
—
VFD Status
9
—
Evaporator Saturated Pressure and Temperature
10
—
Guide Vane 1 Position Percentage
11
—
Motor Load Current Percentage
12
—
Guide Vane 2 Position Percentage
13
—
Evaporator Water Inlet and Outlet Temperature
14
—
Second Stage Bearing Temp
15
—
Refrigerant Pressure Differential
16
—
First Stage Bearing Temp
17
—
Condenser Water Inlet and Outlet Temperature
2
3
4
5
6
7
8
9
10
11
12
1
3
14
15
16
1
17


