Logging and Charting
22
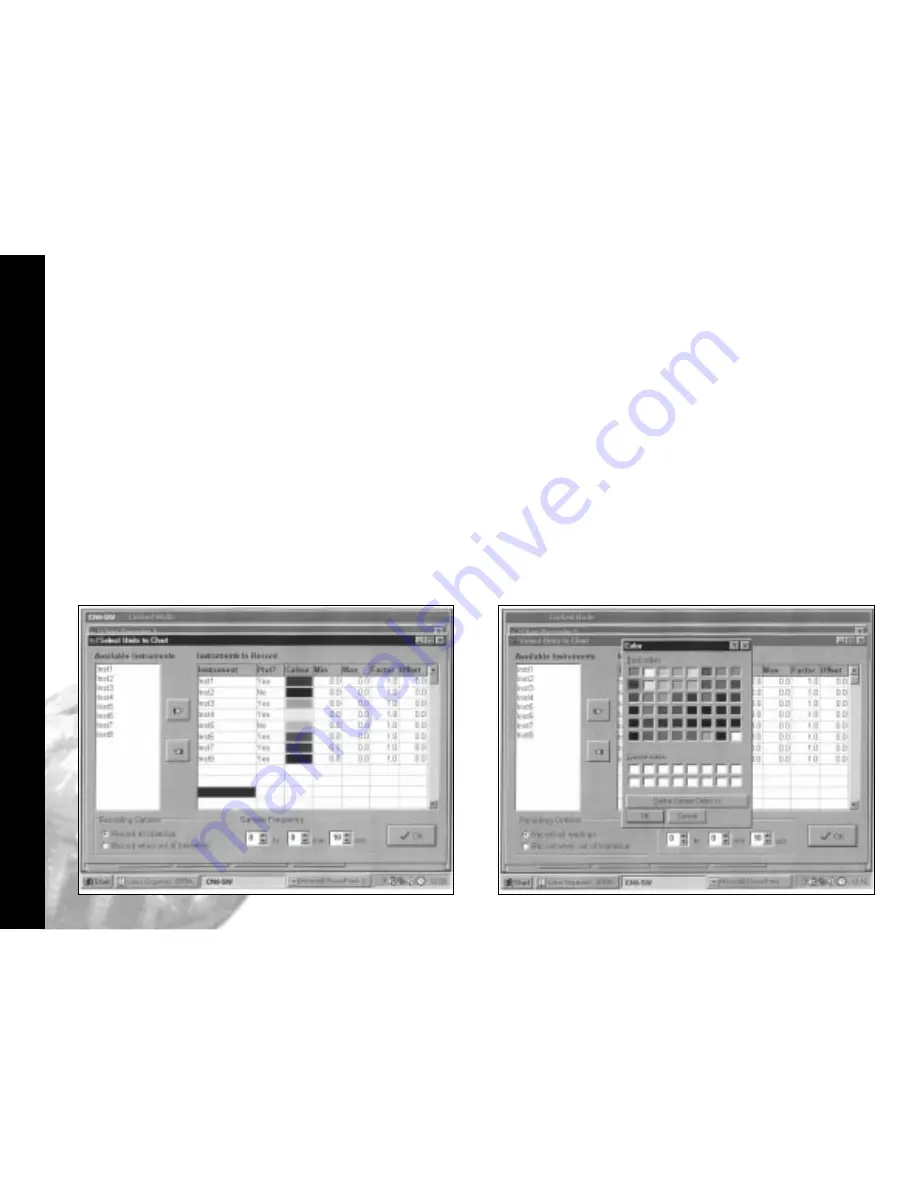
using the
Add to Custom Colour
feature.
Click
the
OK
box in the colour screen.
In the
Sample Frequency
panel,
Click
the
spin buttons
to set the log reading
frequency.
Click
the
OK
button to open the
Chart
Recorder
screen.
In the
Chart Recorder
screen, check that
the
Active File
panel shows the correct
file name, then make the following chart
recorder settings to suit your application,
starting with the
Scaling
panel;
Logging and Charting (continued)
Click
the transfer button to list them in the
Instruments to record
table. For each
instrument to be charted from,
double
click
in the
Plot?
column to change the
No
to
Yes
.
Double click
in each instrument colour panel, and
from the standard
Windows
TM
colour
chart, select contrasting colours that will
effectively display all of the instruments
listed. Additional shades can be added


