CHAPTER 6: MONITORING
VersAtive
®
Pro Enhanced – Operation Manual
6-1
MONITORING
6. Monitoring
There are two basic types of monitoring available by clicking the
Monitoring
tab or
Device
Device Monitoring - Select
Device
tab to Display histograms of the performance and load factors of the system hardware.
Resource Monitoring - Select
Monitoring
tab to provide a live video display of any Ethernet Resource.
6.1 Chapter Contents
•
•
“Preview or Monitor Resources”
•
“Displaying Stream Information”
6.2 Monitoring the Device
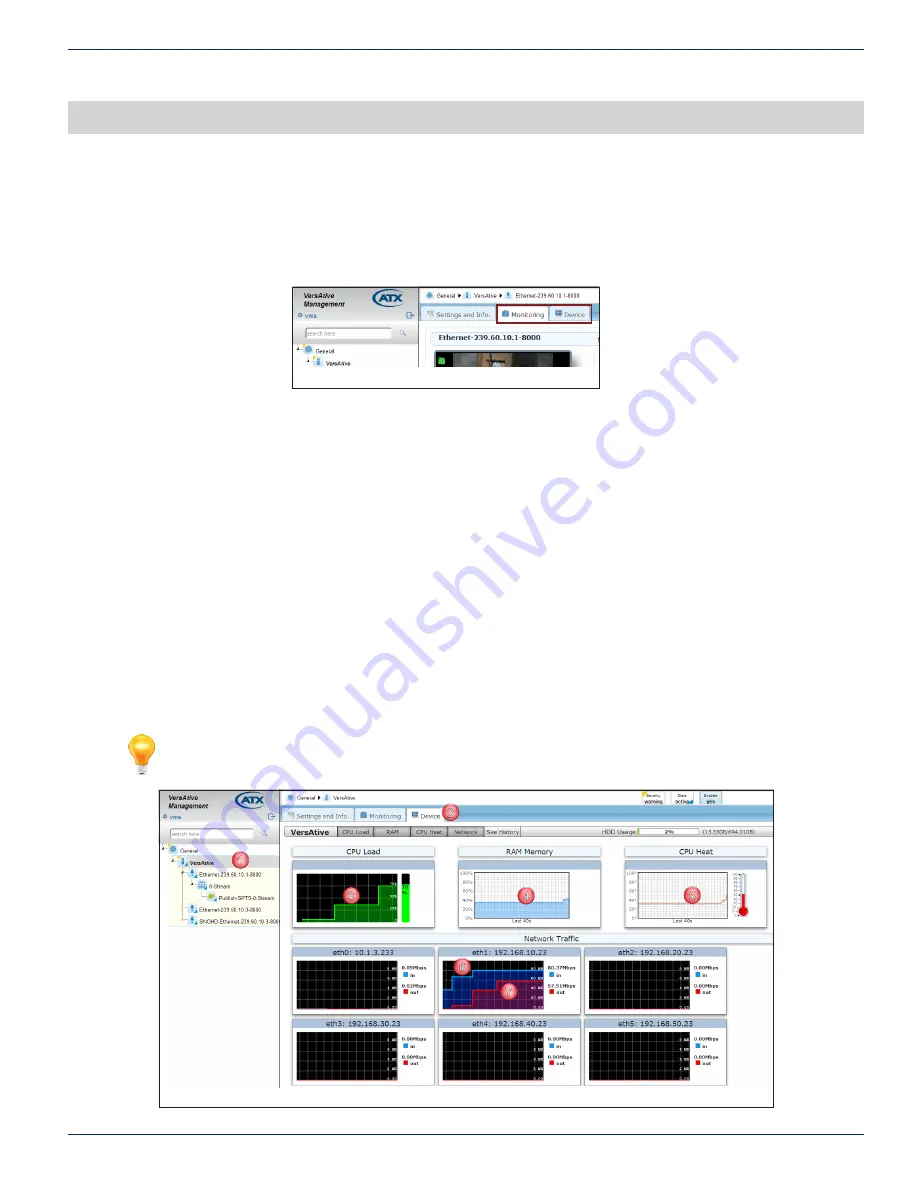
The Device may be monitored at a Hardware level, which is the underlying machine motherboard.
1. In Tree View, click the
Device
2. Click to select the
Device
tab.
3. CPU Load - The histogram of average CPU load over the last 30 seconds displayed in Green.
4. RAM - The histogram of average RAM usage over the last 40 seconds.
5. CPU Heat - The histogram of average CPU temperature over the last 40 seconds.
6. Network Traffic Input- Network Interface input traffic load is displayed in Blue.
7. Network Traffic Output- Network Interface output traffic load is displayed in Red.
Note:
The Monitoring starts recording when the Device tab is selected.
Figure 6-1: Monitoring and Device Tabs
2
3
4
5
6
7
1
Figure 6-2: Monitoring the Device


