


Industrial Managed
Ethernet Switch
User Manual
Configuring
with a Web
Browser
Page
23
of
49
2.4
Diagnostic
The
Diagnostic
function allows the user to check the operation of the managed switch through the following features:
System Log
,
Rmon History
,
Port Statistics
,
LLDP
,
Warning/Alarm
, and
Log Event
. The
Diagnostic
function is the third
circular icon with stethoscope picture on top of a medical chart. Figure 2.19 illustrates the list of features under the
Diagnostic function.
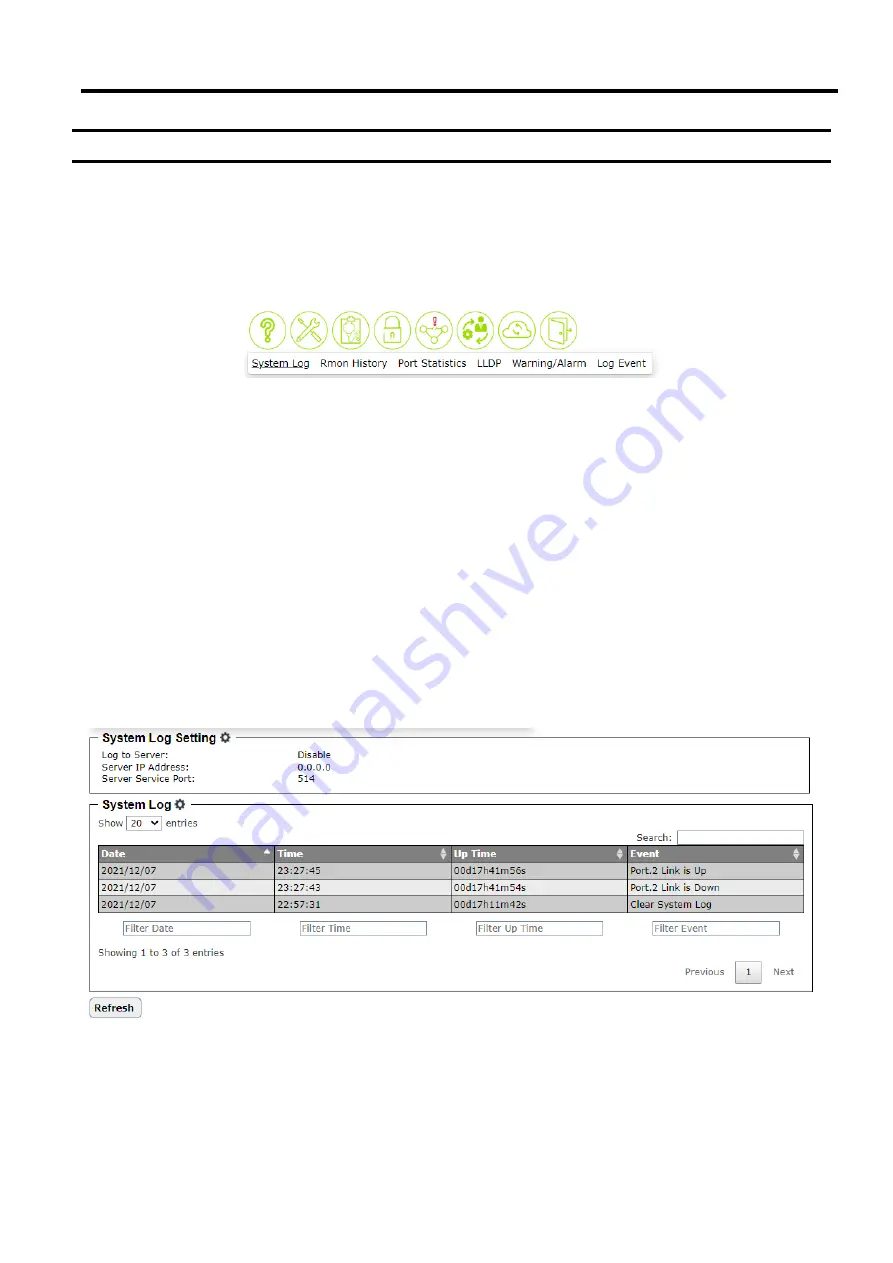
Figure 2.19 Diagnostic Function on Menu Bar
2.4.1
System Log feature
The
System Log
feature under the
Diagnostic
function contains two sections:
System Log Setting
and
System Log
as shown in Figure 2.20. In the upper section, the
System Log Setting
summarizes the current configuration of
system log. To configure the system log, the user can click on the gear icon next to the
System Log Setting
title to
bring up the
System Log Setting
pop-up window as shown in Figure 2.21. Note that this pop-up window is the same
feature as described in
Log
feature under the
Information
function in Section 2.2.3.
In the lower section of the web page, a table of system log is displayed. Each log entry includes
Date
,
Time
,
Up Time
,
and
Event
description. Note that the log entries are sorted by date and time. Table 2.3 in Section 2.2.3 provides
explanation of each column in the
System Log
table. The user can choose how many log entries to be displayed in
the table by selecting the number (20, 50, or 100) from the
Show
’s
drop-down list. Additionally, the user can find
relevant log entries through the
Search
box on the top left of the table. Under each column, the user can filter the log
entries based in Date, Time, Up Time, and Event. The user can also click on the
Refresh
button to obtain the latest
log entries from the managed switch.
Figure 2.20 System Log Feature


