


Chapter 4 Examining Chromatogram Data
4-10
Applied Biosystems
4
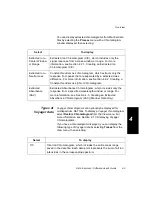
Labeling
spectrum peaks
with mass
difference
(optional)
You can label spectrum peaks with mass differences to assist
you in determining the mass differences to specify in the CNL
extracted chromatogram.
To label spectrum peaks with mass differences:
1.
Display a spectrum of interest from the data file for which
you are creating the CNL extracted chromatogram.
2.
Click the Spectrum window to activate it, then select Peak
Label from the Peaks menu.
3.
In the Peak Mass Label Type, select Mass difference
from the selected peak.
4.
In the Spectrum window, right-click-drag across the peak
from which you are measuring the difference. This enters
a negative value that corresponds to the reference peak in
the text box.
5.
Click OK. The reference peak is labeled with zero, and all
the other peak labels are plus or minus their mass
difference from the reference peak.
For more information on peak labels, see Section 3.5,
Peak Labeling.
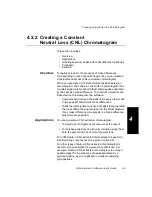
Procedure
To create a CNL extracted chromatogram:
1.
Click the Chromatogram window to activate it.
2.
Select Duplicate Active Trace from the Display menu to
keep the original data displayed after processing.
3.
From the Process menu, select Extracted Ion or click
in the toolbar.
The Extracted Ion Chromatogram dialog box appears
(Figure 4-3).
4.
In the Mass Range/Difference Type field select Neutral
Loss.
Summary of Contents for Data Explorer 4 Series
Page 1: ...Data Explorer Software Version 4 Series Software User Guide ...
Page 10: ...Table of Contents x Applied Biosystems ...
Page 56: ...Chapter 1 Data Explorer Basics 1 42 Applied Biosystems 1 ...
Page 98: ...Chapter 2 Using Chromatogram and Spectrum Windows 2 42 Applied Biosystems 2 ...
Page 172: ...Chapter 3 Peak Detection and Labeling 3 74 Applied Biosystems 3 ...
Page 204: ...Chapter 4 Examining Chromatogram Data 4 32 Applied Biosystems 4 ...
Page 270: ...Chapter 5 Examining Spectrum Data 5 66 Applied Biosystems 5 ...
Page 316: ...Chapter 6 Using Tools and Applications 6 46 Applied Biosystems 6 ...
Page 384: ...Chapter 9 Troubleshooting 9 22 Applied Biosystems 9 ...
Page 388: ...Appendix A Warranty A 4 Applied Biosystems A ...
Page 416: ...Appendix C Data Explorer Toolbox Visual Basic Macros C 20 Applied Biosystems C ...


