


Chapter 4 Examining Chromatogram Data
4-8
Applied Biosystems
4
From the
Spectrum window
To create an extracted ion chromatogram for a mass range
from the Spectrum window:
1.
Click the Chromatogram window to activate it.
2.
Select Duplicate Active Trace from the Display menu to
keep the original data displayed after processing.
3.
In the Spectrum window, right-click-drag over the mass
region of interest in the extracted ion chromatogram. The
width of the box you draw defines the precise mass range
used in the extracted ion chromatogram.
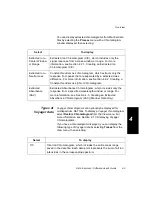
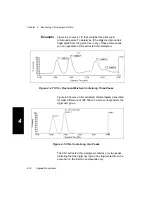
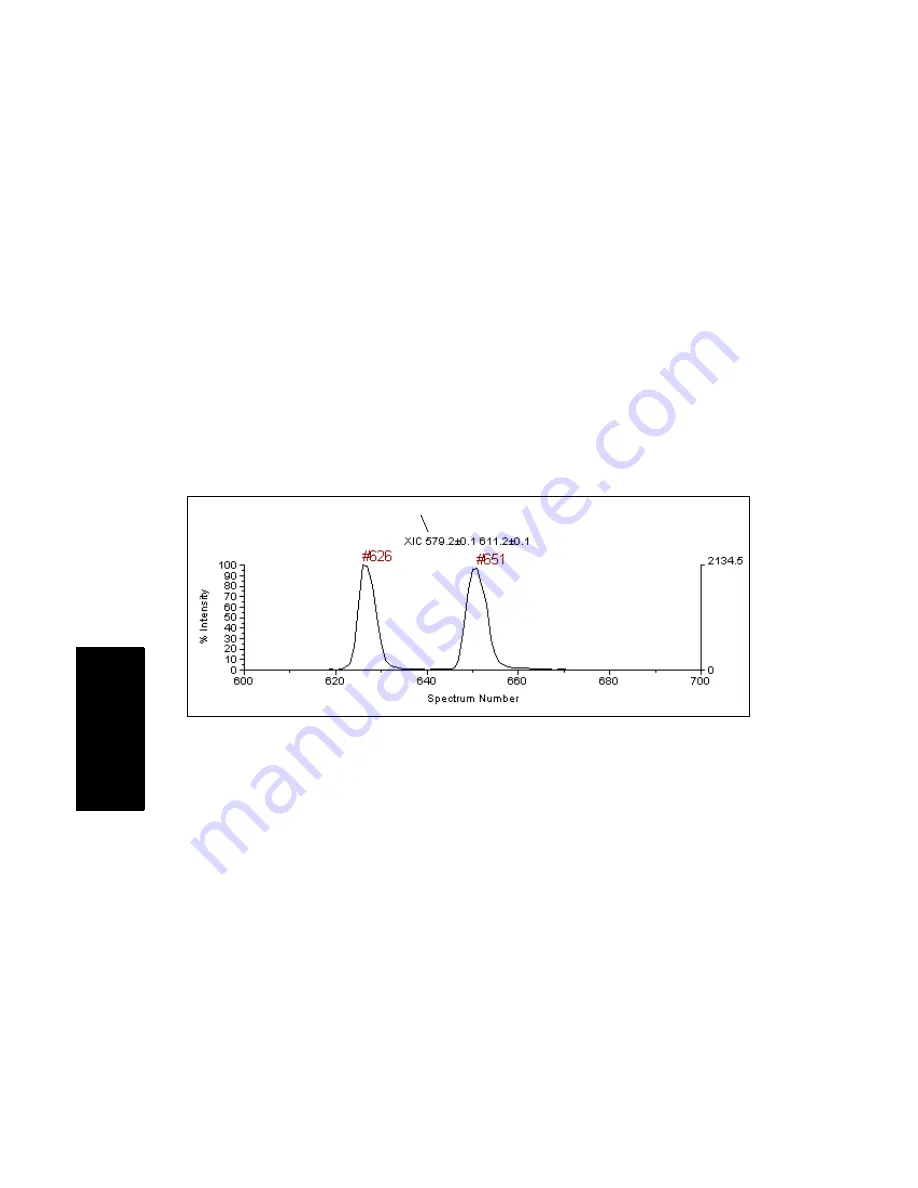
The extracted ion chromatogram is displayed in the
Chromatogram window (Figure 4-2) with the mass
range indicated in the trace label.
Figure 4-2 Extracted Ion Chromatogram
4.
To return to the original trace, see “Returning to the
original trace” on page 4-4.
Extracted ion chromatogram
(center window)
Summary of Contents for Data Explorer 4 Series
Page 1: ...Data Explorer Software Version 4 Series Software User Guide ...
Page 10: ...Table of Contents x Applied Biosystems ...
Page 56: ...Chapter 1 Data Explorer Basics 1 42 Applied Biosystems 1 ...
Page 98: ...Chapter 2 Using Chromatogram and Spectrum Windows 2 42 Applied Biosystems 2 ...
Page 172: ...Chapter 3 Peak Detection and Labeling 3 74 Applied Biosystems 3 ...
Page 204: ...Chapter 4 Examining Chromatogram Data 4 32 Applied Biosystems 4 ...
Page 270: ...Chapter 5 Examining Spectrum Data 5 66 Applied Biosystems 5 ...
Page 316: ...Chapter 6 Using Tools and Applications 6 46 Applied Biosystems 6 ...
Page 384: ...Chapter 9 Troubleshooting 9 22 Applied Biosystems 9 ...
Page 388: ...Appendix A Warranty A 4 Applied Biosystems A ...
Page 416: ...Appendix C Data Explorer Toolbox Visual Basic Macros C 20 Applied Biosystems C ...


