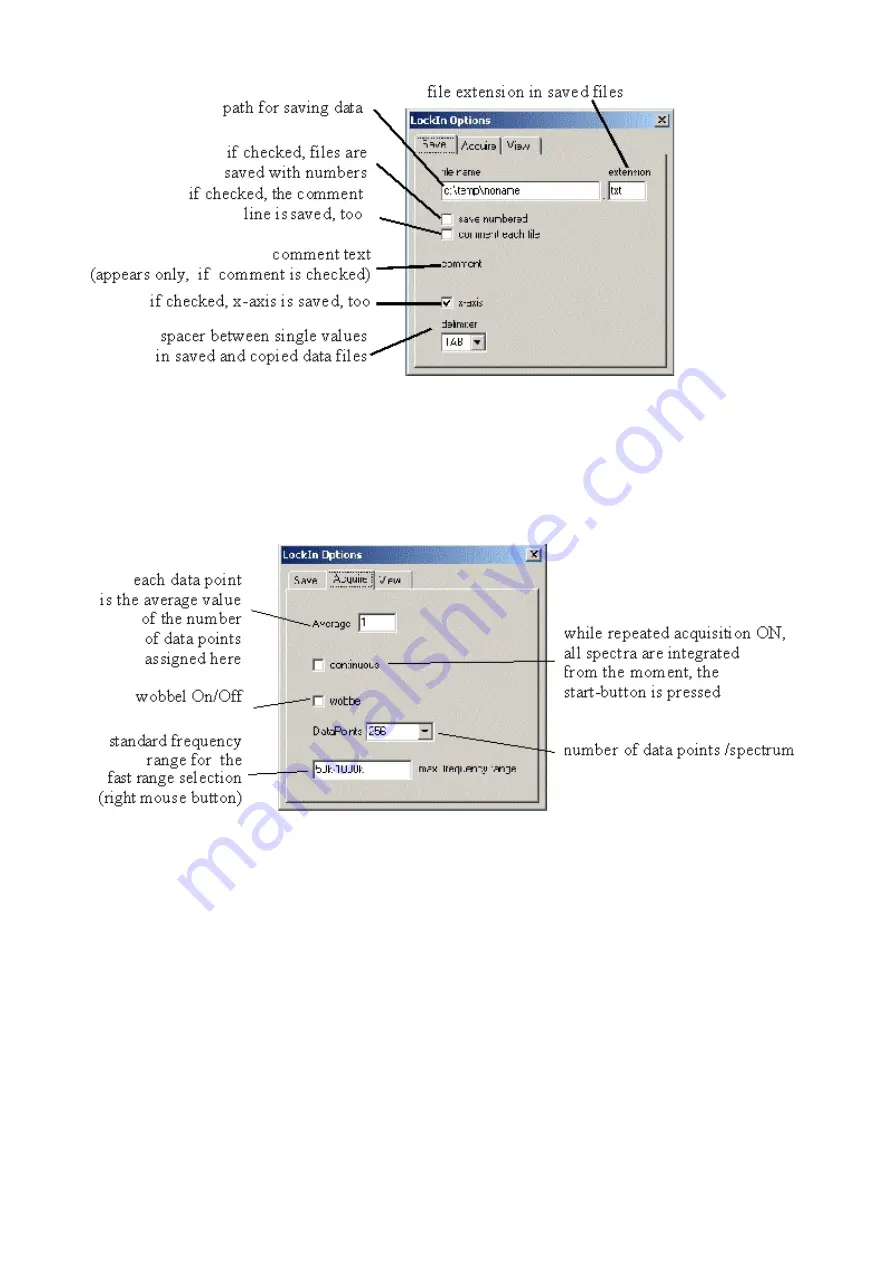
“Wobbel” -
if a large range is scanned for overview purposes and the frequency peak, which should
be found, is too small to be excited (because the single frequency steps are too big), the wobble
option can help. If wobble is checked, the frequency is not kept constant during scan. It is varied
(wobbled) between the neighboured values while the data are taken. This makes sure, that even
small peaks can be found in an overview spectrum with only some 100 data points.
“Standard frequency” -
is the range, which appears at the topmost position, if the right mouse
button is used in the data screen of the “Sweep Frequency” window.
In the data screen, several data curves can be displayed simultaneously.
Therein, the “History depth" is the number of old curves added to the actual one. If the depth is 2,
the actual, the last and the last but one curves are displayed. The actual curve is always of black
colour. The last is red, and the last but one is green. More curves get the usual next colours from the
Windows
TM
palette.
It can be chosen between pixel and vector drawing of data.
Manual Anfatec PCI-Lockin Amplifier AMU5.0 – Rev. 1.01
Page 21 (34)
Figure 11: description of the card "save" in the sweep frequency options.
Figure 12: Description of the card "acquire" of the sweep frequency options.


