background image


27 

3.4.  Configuration of the visualisation 

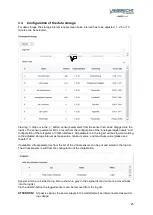
The visualisation will be configured directly on the page „files“, on which the current values are dis-

played.  

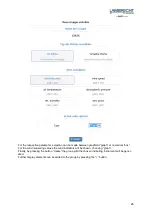
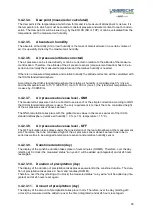
The measurement values to be displayed can be summarised in groups. 

A group can be created via the button “add group to the left” or “add group to the right”. 


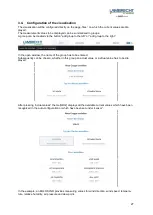
In the open window, the name of the group has to be entered. 

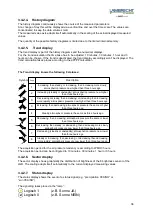
Subsequently can be chosen, whether in this group an actual value or a virtual value has to be dis-

played. 


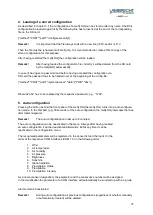
After pressing “actual values“ the met[LOG] displays all the available current values which have been 

recognised in the auto-configuration or which have been set under “sensor”. 


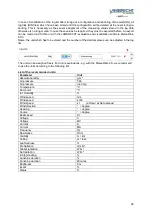
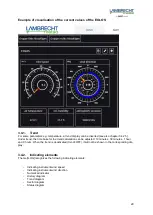
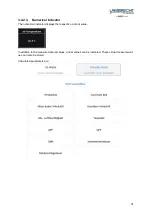
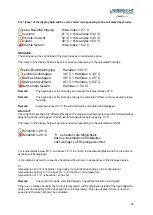
In the example, an EOLOS-IND provides measuring values for wind direction, wind speed, tempera-

ture, relative humidity, air pressure and dew point. 

Summary of Contents for LAMBECHT METEO 00.95800.010000

Page 1: ...erfaces 4 analogue digital inter faces and connection to LAN Ethernet The met LOG has an integrated web server which allows for calling and displaying data directly via a browser Warnings and alarms c...

Page 2: ...play of wind peak and maximum gust o Calculation and display of heat index humidex or wind chill o Calculation of dew point o Calculation of absolute air humidity o Altitude correction of air pressure...

Page 3: ...following LAMBRECHT sensors with voltage frequency impulse and status output can be connected The voltage output can be configured from 0 10 V and displayed with 16Bit ap prox 0 15 V Analogue sensors...

Page 4: ...altitude corrected 35 3 4 2 3 7 Air pressure above sea level QNH 35 3 4 2 3 8 Air pressure above sea level QFF 35 3 4 2 3 9 Sunshine duration day 35 3 4 2 3 10 Duration of precipitation day 35 3 4 2 3...

Page 5: ...by HTTP 51 12 1 Identification of the logger 51 12 2 Access to the instantaneous values 52 12 3 Access to sliding wind data 53 12 4 Storage format 54 12 4 1 Formulas Calculations 55 12 4 2 Annex formu...

Page 6: ...s additional connecting terminals to plug in the serial and analogue meteorological sensors of LAMBRECHT meteo Mounting on the profile rail The met LOG can be fastened on the profile rail of the power...

Page 7: ...y An alternative IP address can be chosen by using a special configuration Connecting to power supply The dot cycle on the front side points in the direction of terminal 1 The met LOG can be supplied...

Page 8: ...l Please read the appropriate sensor manual prior to operation with met LOG Remark Please note that the RS485 interfaces of met LOG are not decoupled isolated In case of disruptions a suitable galvani...

Page 9: ...9 Wiring diagram EOLOS...

Page 10: ...10 Wiring diagram ARCO Modbus...

Page 11: ...11 Wiring diagram rain e Modbus...

Page 12: ...us ARCO Modbus rain e Modbus The use of the met LOG in combination with the power cube is enabled by mounting the data logger on a DIN profile rail inside the power cube The following pictures show co...

Page 13: ...13 Connection example with power cube met LOG EOLOS Modbus rain e Modbus...

Page 14: ...14 Connection example with power cube met LOG u sonic...

Page 15: ...the general settings of the met LOG any time Alternatively configuration of the sensors can also be done manually 1 4 Calling the integrated web page The met LOG has an integrated web page With the w...

Page 16: ...le name In this case the configuration file is not read If there is a password set it should be added to the SD card before accepting the configuration Please use the following command method POST pat...

Page 17: ...available for about 10 seconds After 10 seconds the met LOG web page can be displayed again In case of not storing a configuration it will be deleted with the very first change of a web page 3 1 Gener...

Page 18: ...here Activate Access Protection To avoid non authorized modification of the configuration a password protected access protection can be activated The met LOG has no user management Therefore one user...

Page 19: ...ual time registration time source manually has to be chosen and to be stored After day month year hour 24 hours and minute have been set they can be taken over by the met LOG by pressing the button ac...

Page 20: ...tion in mm since the device has been switched on From the total amount the met LOG calculates the amount of precipitation in mm for each storage interval 3 2 3 Configuration of the rain e SDI 12 on RS...

Page 21: ...ts Analogue digital inputs allows for selection of analogue sensors with a voltage output digital sensors with frequency impulse or status output or NTC temperature sensor Apart from the signal type a...

Page 22: ...maximum of 3 per second 3 Hz Status Using digital signals it can be adjusted whether there is an active signal with low or high level or a passive signal e g relay or OC At an active signal the volta...

Page 23: ...the power supply in the met LOG will be interconnected as a switching voltage Frequency At the frequency the frequency range min max and the scaling can be adjusted It is possible to choose an active...

Page 24: ...24 NTC temperature sensor Temperature measurement with the NTC temperature sensor is possible For the NTC the R0 re sistance value is in kOhm and its B value has to be inserted...

Page 25: ...ers in the log list will be stored according to the adjusted storage interval as mean value minimum value and maximum value please see chapter 10 If available virtual parameters from the list of the v...

Page 26: ...d and the number of the decimal places can be adjusted in the log list The unit can be assigned freely For future evaluations e g with the MeteoWare CS we recommend to use the units according to the f...

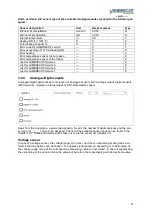
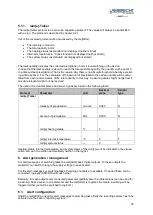
Page 27: ...o the right In the open window the name of the group has to be entered Subsequently can be chosen whether in this group an actual value or a virtual value has to be dis played After pressing actual va...

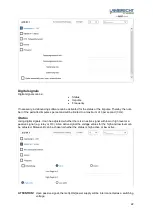
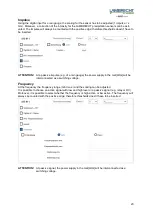
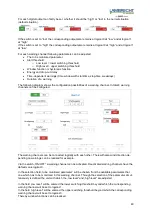
Page 28: ...h or numerical box For the wind measuring values the wind indicators will be shown choosing graph Finally by pressing the button create the group with the chosen indicating instrument will be gener at...

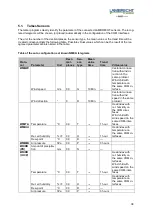
Page 29: ...e trend calculation can be adjusted 10 minutes 30 minutes 1 hour and 3 hours When the trend is deactivated trend OFF it will not be shown in the corresponding dis play 3 4 2 Indicating elements The me...

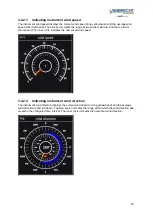
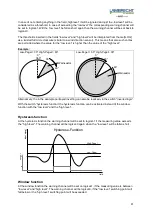
Page 30: ...the minimum wind speed The inner circle indicates the numerical wind speed 3 4 2 2 Indicating instrument wind direction The instrument wind direction displays the current wind direction long yellow h...

Page 31: ...indicator The numerical indicator displays the respective current value In addition to the measured actual values virtual values can be indicated These virtual measured val ues can also be stored Calc...

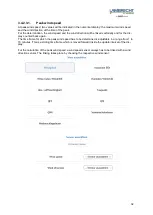
Page 32: ...nked vectorially and for the dis play counted back again The time frame for which the peak wind speed has to be determined is adjustable in a range from 1 to 10 minutes This is a sliding time frame wh...

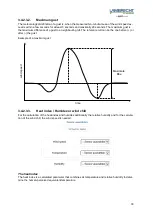
Page 33: ...The reference lull can be the one before or after the gust Example of a maximum gust wind speed Maximale B e time 3 4 2 3 3 Heat index Humidex or wind chill For the calculation of the heat index and h...

Page 34: ...es the difference between the measured air temperature and the felt temperature depending on the wind speed It is defined for temperatures below approx 10 C The lamp of the display field will be color...

Page 35: ...e can be corrected to sea level For the simple correction according to QNH the ICAO standard atmosphere is used The only requirement is to insert the to be considered height of the air pressure sensor...

Page 36: ...heric pressure the same as three hours ago Decreasing or steady then increasing or increasing then increasing more rapidly atmospheric pressure now higher than three hours ago Decreasing then steady o...

Page 37: ...34 5 Auto configuration Pressing the button behind the front panel of the met LOG the met LOG turns into a auto configura tion mode In the first part e g 30 seconds of the auto configuration the met L...

Page 38: ...0 0 G 10 Min Vectorial connec tion with wind di rection in the same protocol Wind chill with temperature on the same COM in terface Wind direction 0 R 10 Min Vectorial connec tion with wind speed in t...

Page 39: ...The used units decimal places and sensor types are listed in the following table Protocol Parameter Unit Decimal place Sensor type rain e Talker Intensity of precipitation mm min 0 000 N Amount of pre...

Page 40: ...ities of a warning channel In total 8 warning channels can be configured The warning channels can be connected logically with each other Therewith also wind direction de pending on warnings can be rea...

Page 41: ...ektor Low Pegel 60 High Pegel 30 0 360 30 60 Warnsektor Alternatively the in the example portrayed inverting can also be realized via the switch inverted logic With the switch hysteresis function the...

Page 42: ...g chan nel which can be selected in the selection series warning channel 1 8 The switch has got 3 states AND on click OR two clicks or OFF three clicks In case of choosing no warning channel the switc...

Page 43: ...fied Therefore at each warning channel can be inserted test values see example illustration above Will the button logic test be pressed the logic calculation with the in the field test parameter inser...

Page 44: ...is possible to choose timeframe and a day of the week for alerting in a warning channel Either can this date be connected directly with the to be monitored parameter or the time itself is the to be mo...

Page 45: ...a an open collector o Active output level configurable e g logical 0 0 V and logical 1 5 V 9 1 NMEA protocol Following LAMBRECHT sensors are using the NMEA protocol as a talker EOLOS IND EOLOS MET WEN...

Page 46: ...separator comma Header WIMWV Wind direction WD 0 0 to 360 0 R relative wind direction Wind speed WS 0 3 to 75 0 M metric unit in m s Status A valid V not valid Telegram end CR LF Error code WR 999 9...

Page 47: ...onnected LAMBRECHT precipitation sensor Each impulse increases the value by 0 1 In case of increasing the value 10 the value will be reset to 0 1 The actual amount of precipitation is always the diffe...

Page 48: ...of via the met LOG Precipitation intensity of the last minute mm min Precipitation amount since the last call off mm m Temperature interior C Heating ON 1 OFF 0 Total heating capacity Error states o...

Page 49: ...l inputs can be activated Thereby the number of the permitted impulses per second is limited to a maximum of 3 per second 3Hz 9 3 4 2 Rain gauges with pulse output linearization Rain gauges with tippi...

Page 50: ...d 360 but has to be calculated vectorially due to the full circle vectorial means value with unit vec tors Wind speed and wind direction vectorially connected For alternative measurements of wind spee...

Page 51: ...Date hh mm ss yyyy mm dd Sensor name 1 Unit 1 Decimal places 1 Sensor type 1 Sensor name n Unit n Decimal places n Sensor type n Die fields are separated by a comma Following coding will be used for t...

Page 52: ...uiv Content Type content text html charset iso 8859 1 TITLE momview TITLE HEAD BODY PRE 11 10 2011 17 03 39 01 00 227 0 4 8 14 0 9999 0 95 9 13 3 988 3 0 0 PRE BODY HTML As a block PRE PRE following d...

Page 53: ...d direction mean value Wind direction start segment in clockwise direction Wind direction end segment in clockwise direction Sensor position in sequence out of statdef htm Wind speed mean value Wind s...

Page 54: ...time zone Float measuring value 1 mean value or sum Float measuring value 1 Minimum Float measuring value 1 Maximum Word sensorID 1 Float measuring value n mean value or sum Float measuring value n M...

Page 55: ...away from the heat Ozone levels can be elevated in this case Index 27 32 States of exhaustion are possible at longer duration and or physical activities avoid midday heat Index 32 41 Sunstrokes muscl...

Page 56: ...1 12 4 6 Annex formula dew point The dew point DT is calculated as follows DT c3 ln 0 01 RH SVP TT c1 c2 ln 0 01 RH SVP TT c1 Thereby DT Dew point temperature in C RH relative humidity in SVP TT Satur...

Page 57: ...ir pressure QFE corrected air pressure from the measuring point to the reference plane HF altitude difference to the measuring point in m T 273 15 K t with t air temperature in C Ch Constant 0 12 K hP...

Page 58: ...Annex formula air pressure over sea level QFF The QFF calculation takes place under consideration of the real atmosphere at the measuring point QFF Bn 2 7182183 HB 0 03416356 T e Ch HB 0 00325 whereb...

Page 59: ...es or electromagnetic fields which are beyond the standards and specifications in the technical data 3 Damages caused by improper handling e g by wrong tools incorrect installation incorrect electri c...

Page 60: ...c 10 22 _________________________________________________________________________________ LAMBRECHT meteo GmbH Tel 49 0 551 4958 0 Friedl nder Weg 65 67 Fax 49 0 551 4958 312 37085 G ttingen E Mail in...

Reviews: