75
Appendix F
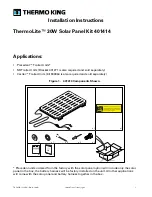
Figure F.13: Plot Calibration Data
Draw
This is to test the touch screen operation. Its display shows touch loca-
tion.
Note
Plot Calibration Data enabled provides the blue
lines to show linearity before calibration and
black lines to show linearity after calibration
when you finished the advanced calibration.
Summary of Contents for TPC-1070
Page 1: ...TPC 1070 Intel Touch Panel Computer with High Luminance 10 4 SVGA TFT LCD User Manual...
Page 8: ...TPC 1070 User Manual viii...
Page 12: ...TPC 1070 User Manual xii...
Page 21: ...2 CHAPTER 2 System Setup...
Page 25: ...2 CHAPTER 3 System Engine...
Page 32: ...TPC 1070 User Manual 20 Step 5 Click uninstall icon to remove PCI Serial Port...
Page 33: ...21 Chapter4 Step 6 Click the scan for hardware changes icon to remove PCI Serial Port...
Page 34: ...TPC 1070 User Manual 22 Step 7 Found New Hardware and Click Next to continue installation...
Page 40: ...TPC 1070 User Manual 28 Step 3 Click Next to proceed...
Page 47: ...2 CHAPTER 5 Windows XP Embedded Sections include EWF HORM Advantech Utilities...
Page 51: ...2 APPENDIX A Serial Port Settings...
Page 54: ...TPC 1070 User Manual 42...
Page 55: ...2 APPENDIX B Watchdog Timer on WinCE 5 0...
Page 62: ...TPC 1070 User Manual 50...
Page 63: ...2 APPENDIX C Watchdog Timer Programming...
Page 77: ...2 APPENDIX E HDD Kit Assembly...
Page 81: ...69 AppendixF Figure F 3 Install License Agreement Figure F 4 Install Completed...
Page 84: ...TPC 1070 User Manual 72 Figure F 8 Standard Calibration 1 Figure F 9 Standard Calibration 2...
Page 86: ...TPC 1070 User Manual 74 Figure F 11 Advanced Calibration 1 Figure F 12 Advanced Calibration 2...
Page 90: ...TPC 1070 User Manual 78...