8-1
IM DLM3054-01EN
8 Displaying XY Waveforms
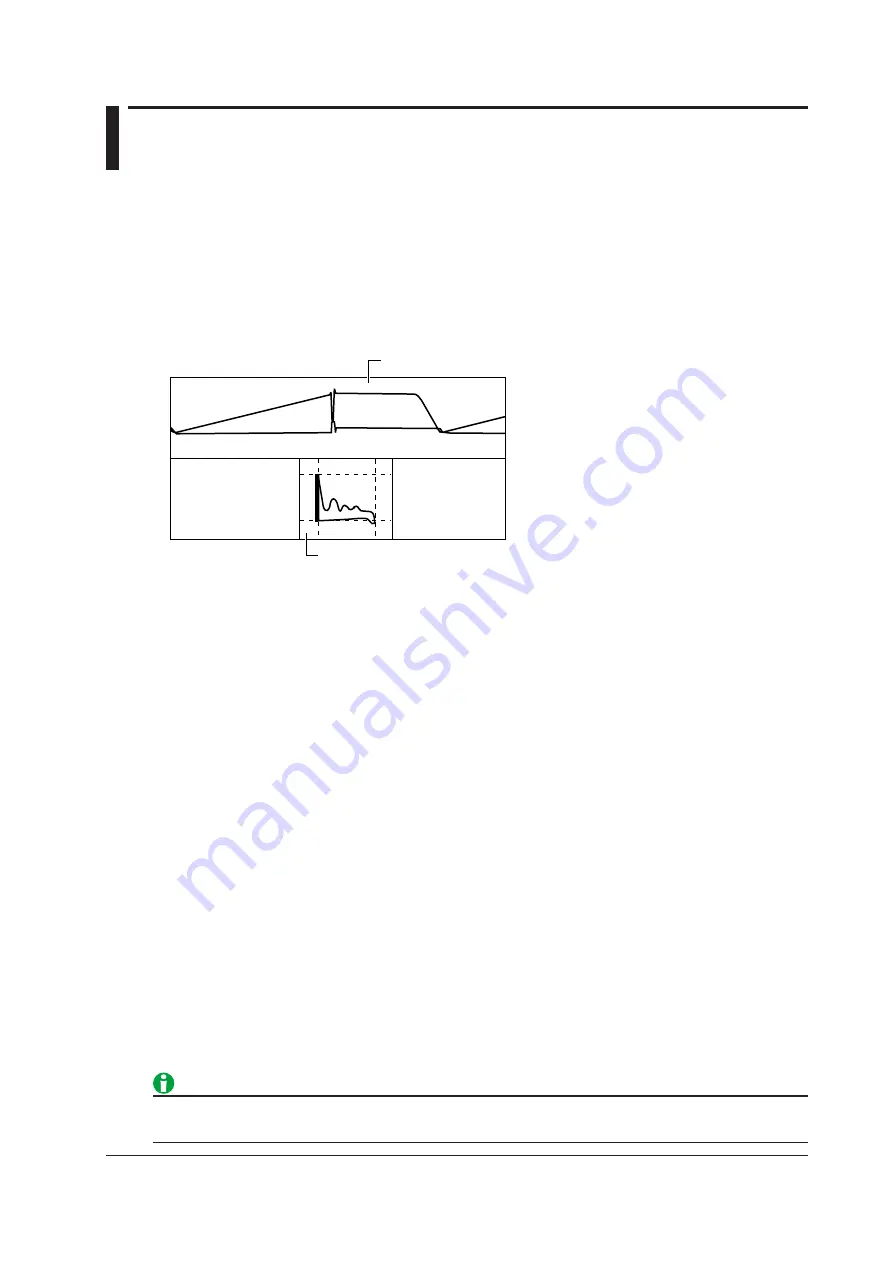
You can view the correlation between two input signal levels by assigning the level of a waveform to the X-axis
(horizontal axis) and assigning the level of another waveform to the Y-axis (vertical axis). XY waveforms appear
in the XY window.
You can perform cursor measurements on and determine the area of the displayed XY waveform. You can view
XY waveforms and normal VT waveforms simultaneously.
For example, you can use the XY waveform display to measure the area of safe operation (SOA) of switching
elements.
You can configure up to two XY waveforms: XY1 and XY2.*
* Only XY1 on the 2-channel model.
XY display (X-axis: CH1, Y-axis: CH2)
Main window
CH2
CH1
XY window
VT waveform display window
Turning the XY Waveform Display On and Off (Display)
Sets whether or not to measure and display XY waveforms. If you set this to ON, the XY window appears.
• ON: Displays and measures XY waveforms
• OFF: Does not display or measure XY waveforms
X-Axis and Y-Axis Source Waveforms (X Trace/Y Trace)
Select the waveforms to assign to the X-axes and Y-axes of the XY1 and XY2 waveforms. The available settings
vary depending on the model.
CH1 to CH4, Math1 to Math4
Configuring the Display (Display Setup)
Displaying the VT Waveforms (VT Display)
Sets whether or not to display XY waveforms along with the VT waveforms.
• ON: Displays the VT waveform display window
• OFF: Does not display the VT waveform display window
Split Display (Split)
Sets whether or not to display the XY1 and XY2 waveforms in separate windows.
• ON: Enables the split display
• OFF: Disables the split display
If you press DISPLAY, ZOOM1, or ZOOM2 when the VT waveform display (VT Display) is OFF, the VT
waveform display window turns on.


