11-2
Measurement Methodology
11.2
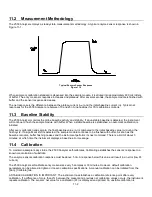
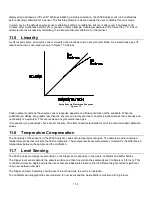
The 2500 Analyzer employs a steady state measurement methodology. A typical enzyme sensor response is shown in
Figure 11-1.
Typical Enzyme Sensor Response
Figure 11-2
When sample or calibration standard is dispensed into the sample module, it is diluted into approximately 600 microliters
of buffer. The enzyme sensor response increases and plateaus. After several seconds, the sample module is flushed with
buffer and the sensor response decreases.
The net response is the difference between the plateau current (i
plat
) and the initial baseline current (i
ib
). Typical net
responses for the 2500 Analyzer are between 10 and 25 nA (nanoamps) for YSI calibration solutions.
Baseline Stability
11.3
The 2500 Analyzer monitors the probe baseline activity and stability. If an unstable baseline is detected, the instrument
will continue to flush the sample module with buffer. When a stable baseline is established, an automatic calibration is
initiated.
After every calibration and sample, the final baseline value (i
fb
) is compared to the initial baseline value (i
ib
) during the
flush cycle. If a significant shift is detected, the sample module continues to be flushed with buffer. As soon as the
baseline recovers, buffer flushing ceases and the instrument performs its next command. There is a limit of about 3
minutes, at which time the instrument displays a baseline error message.
Calibration
11.4
To maintain a sample ready status, the 2500 Analyzer self-calibrates. Calibrating establishes the sensors’ response to a
known concentration of substrate.
The enzyme sensors calibration response must be above 5 nA. A response below this value will result in an error (low PL
current).
The 2500 Analyzer self-calibrates enzyme sensors every 5 samples or 30 minutes. However, default calibration
parameters can be altered to tighten or loosen calibration specifications. A manual calibration can be initiated from the
[Run], [Calibrate] tab.
A STABLE CALIBRATION IS IMPORTANT. The instrument re-establishes a calibration reference point after every
calibration. If a difference of more than 2% between the present and previous net calibration values occurs, the instrument
repeats calibration. The sensors’ net value for a calibration (PL) is displayed and printed. An unstable calibration is
Содержание YSI 2500
Страница 1: ...USER MANUAL 525021 YSI 2500 Biochemistry Analyzer OPERATIONS AND MAINTENANCE MANUAL...
Страница 34: ...5 11 8 The Stat sample results are displayed on the Run Stat tab Stat sample results...
Страница 88: ...13 1 13 Notices Declaration of Conformity 13 1...
Страница 96: ...17 1 17 Appendix D Line Power Cord and Plug Wiring United Kingdom United States Europe...


