SonTek RS5 User Manual (August 2020) 48
Measurement
Component
Variable
Action
Message
Criteria
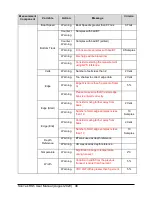
System
Operation
Battery Voltage
Warning
Replace Batteries
Missing Sample
Counter /
Warning
Missing Samples
Counter
Start Edge
Counter
Transect
Counter
End Edge
Warning
9 consecutive missing samples. Total
discharge will be biased low.
9 Samples
Matlab
Export
No automated Matlab export if missing
samples are present
6.5.6 Profile Plot
The default display shows the SNR profile for each beam for that sample. The parameter plotted
and can be changed by
right-clicking
on the plot.
6.5.7 Main Data Display
The main data display is the large area of the software where the main data parameters
in various forms are plotted.
Right-clicking
on plots provides options for configuring the
plots.
6.5.8 Data Tabs
Data tabs offer different views of various data during the measurement. They include:
Smart Page – view Smart Page for current setup parameters and settings
Samples – tabular view of individual samples
Edges – tracks, profiles, and contour plots of edge data
Navigation – view the track(s) in a large plot with a contour plot
Time Series – view various time series
Transect – comprehensive view of time series, track, and contour plots
6.5.9 Discharge Summary
The discharge summary is a tool that gives a user a quick view to the files collected during the
measurement session. From this display you can get a quick look at statistics and other
parameters to make decisions about your data collection. The discharge summary can be


