


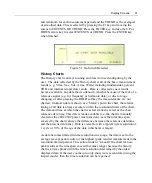


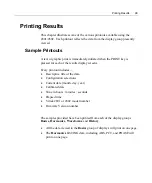


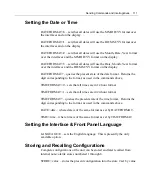

Display Screens
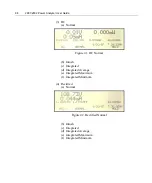
97
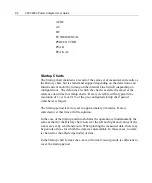
DC
FUNDAMENTAL
PERCENT THD
PEAK
PEAK AC
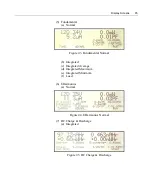
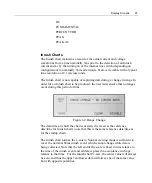
Inrush Charts
The Inrush chart maintains a record of the actual current and voltage
waveforms from a time nominally 3ms prior to the detection of an Inrush
current and/or by the turning on of the internal line switch (depending on
configuration) to nominally 65ms afterwards. Data is viewable with a typical
time resolution of 4.1 microseconds.
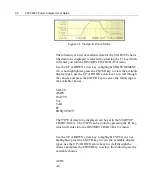
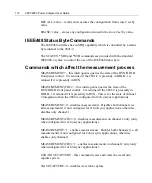
The Inrush chart is not capable of capturing data during a change in range. In
order for an Inrush chart to be produced, the user must ensure that no ranges
occur during this period of time.
Figure 62. Range Change
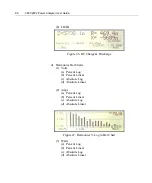
The date/time at which the chart was started is saved as the reference
date/time for Inrush charts (note that this is the same reference date/time as
for the startup chart).
The Inrush chart format, the x-axis in Normal viewing mode is sufficient to
cover the nominal 68ms inrush event, which cannot change while data is
being collected. Note that the left end of the scale is fixed in time relative to
the time of the inrush event and all data is placed in accordance with age
relative to that time. For the Inrush chart Y-axis, the center value will always
be zero, and thus the upper and lower data will always be of the same value
but with opposite polarities.
Содержание Xitron 2801
Страница 1: ...USER GUIDE 2801 2802 Advanced Single and Dual Channel Power Analyzers...
Страница 2: ...2 2801 2802 Power Analyzer User Guide...
Страница 10: ...10 2801 2802 Power Analyzer User Guide...
Страница 19: ...Functional Description 19 Voltage Input Attenuator Figure 2 Voltage Input Attenuator Block Diagram...
Страница 101: ...Printing Results 101 Figure 66 Configuration Printout...
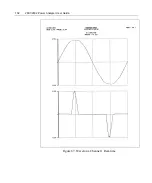
Страница 102: ...102 2801 2802 Power Analyzer User Guide Figure 67 Waveform Channel 1 Real time...
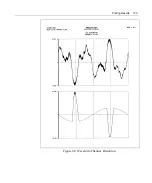
Страница 103: ...Printing Results 103 Figure 68 Waveform Channe1 Distortion...
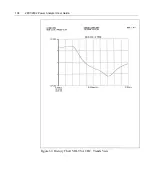
Страница 104: ...104 2801 2802 Power Analyzer User Guide Figure 69 History Chart VOLTS ACDC Trends View...
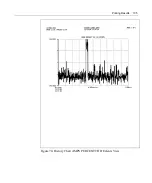
Страница 105: ...Printing Results 105 Figure 70 History Chart AMPS PERCENT THD Extents View...
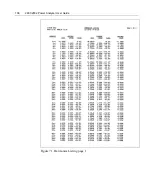
Страница 106: ...106 2801 2802 Power Analyzer User Guide Figure 71 Harmonics Listing page 1...
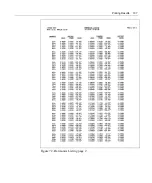
Страница 107: ...Printing Results 107 Figure 72 Harmonics Listing page 2...
Страница 145: ...Sending Commands and Interrogatives 145...
Страница 147: ...Appendix A Physical Specifications 147...
Страница 153: ...Appendix B Measurement Specifications 153...


