Working with Traces Annotated by Expert
Chapter 17, Annotated Traces, Expert Traces, and Decode Switches
Xgig Analyzer User’s Guide
383
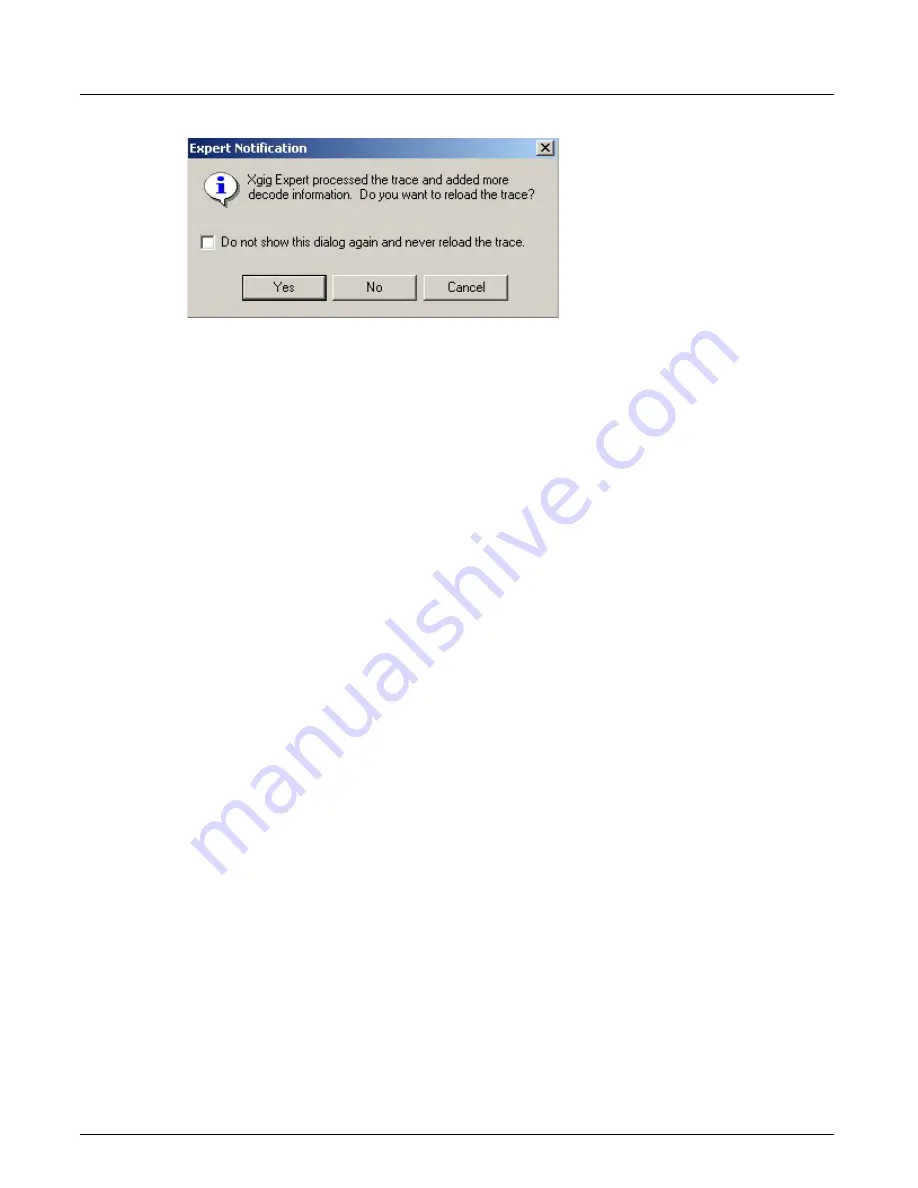
Figure 173: Reload Trace Dialog Box
.
If TraceView is not open the notification message will not appear, but the annotations will be
available the next time you load the trace in TraceView.
You can add columns to TraceView's spreadsheet in order to view all the expert annotations in a
trace. The
Expert\ExpertAnnotationInfo
column can be found in the Insert Column dialog (see
Expert\ExpertAnnotationInfo
columns display the annotations from Xgig Expert 3.0 and above.
It is strongly recommended that you re-process older traces with the new version of Xgig Expert to
add additional expert information to the trace.
Viewing Partial Annotation in TraceView
The processing of annotations in Expert can take an extended period of time. However you can
load the annotations that have already been processed by Expert up to any point in time so that
they may be viewed immediately in TraceView. While you are viewing the partial annotations in
TraceView, Expert continues running in the background until it has finished. You may load partial
annotations during the process if need be.
Looking at the bottom of Figure 174, “Partial Annotations in TraceView, note that there are two
colored lines; a magenta-colored line and a teal-colored line in the histogram area.
•
The magenta-colored line shows the portion of the trace that has already been processed by
Expert and the annotations generated by Expert has been loaded into and can currently be seen
in TraceView.
•
The teal-colored line shows the portion of the trace that has already been processed by Expert
that is available to be loaded into TraceView at this point.
•
The uncolored area to the right of the teal-colored line shows the portion of the trace that has
not yet been processed by Expert.
To update TraceView so that you can view the annotations for the Teal-colored portion of the
trace:
1
Close the trace in TraceView by clicking the
Close
button that is circled in red near the top
right corner of Figure 174.
2
Open the trace again in TraceView.
Once the trace is reopened, you will note that the magenta-colored line has lengthened toward the
right (and the teal-colored portion of the line is now very small) showing you that more
annotations are available to be viewed in TraceView.
Содержание Xgig
Страница 1: ...Xgig Analyzer Version 7 3 User s Guide ...
Страница 2: ......
Страница 3: ...Viavi Solutions 1 844 GO VIAVI www viavisolutions com Xgig Analyzer Version 7 3 User s Guide ...
Страница 6: ...Xgig Analyzer User s Guide Page iv Version 7 3 December 2015 ...
Страница 7: ...v CONTENTS ...
Страница 15: ...1 PART ONE Using Xgig Analyzer ...
Страница 16: ...PART ONE Using Xgig Analyzer 2 Xgig Analyzer User s Guide ...
Страница 27: ...13 PART TWO Using Xgig TraceControl ...
Страница 28: ...PART TWO Using Xgig TraceControl 14 Xgig Analyzer User s Guide ...
Страница 29: ...15 Chapter 2 About Xgig TraceControl In this chapter Introduction to TraceControl ...
Страница 156: ...Chapter 4 Xgig TraceControl Capture Configuration Segment Capture Options 142 Xgig Analyzer User s Guide ...
Страница 157: ...143 Chapter 5 Template Browser Template Editor In this chapter Template Browser Template Editor ...
Страница 173: ...159 Chapter 6 Xgig TraceControl Hints and Tips In this chapter TraceControl Hints and Tips Keyboard Shortcuts ...
Страница 176: ...Chapter 6 Xgig TraceControl Hints and Tips Keyboard Shortcuts 162 Xgig Analyzer User s Guide ...
Страница 177: ...163 PART THREE Using Xgig Performance Monitor ...
Страница 178: ...PART THREE Using Xgig Performance Monitor 164 Xgig Analyzer User s Guide ...
Страница 179: ...165 Chapter 7 About Xgig Performance Monitor In this chapter Introducing Xgig Performance Monitor ...
Страница 181: ...167 Chapter 8 Getting Started with Xgig Performance Monitor In this chapter Launching Xgig Performance Monitor ...
Страница 192: ...Chapter 9 Xgig Performance Monitor Port Configuration Changing Port Functions 178 Xgig Analyzer User s Guide ...
Страница 223: ...209 PART FOUR Using Xgig TraceView ...
Страница 224: ...PART FOUR Using Xgig TraceView 210 Xgig Analyzer User s Guide ...
Страница 225: ...211 Chapter 11 About Xgig TraceView In this chapter Introducing Xgig TraceView ...
Страница 227: ...213 Chapter 12 Getting Started with Xgig TraceView In this chapter Launching Xgig TraceView Working With Domains ...
Страница 379: ...365 Chapter 15 Xgig TraceView Histograms In this chapter Histogram Overview Histogram Controls ...
Страница 382: ...Chapter 15 Xgig TraceView Histograms Histogram Controls 368 Xgig Analyzer User s Guide ...
Страница 383: ...369 Chapter 16 Xgig TraceView Template Editor In this chapter Using Template Editor ...
Страница 394: ...Chapter 16 Xgig TraceView Template Editor Using Template Editor 380 Xgig Analyzer User s Guide ...
Страница 414: ...Chapter 18 Converting Files from Other Platforms Converting I Tech Files 400 Xgig Analyzer User s Guide ...
Страница 429: ...415 Chapter 20 Xgig Trace View Hints and Tips In this chapter Trace View Hints and Tips Toolbar Keyboard Shortcuts ...
Страница 437: ...423 PART FIVE Using Xgig Expert ...
Страница 438: ...PART FIVE Using Xgig Expert 424 Xgig Analyzer User s Guide ...
Страница 439: ...425 Chapter 21 Xgig Expert In this chapter Key Features of Xgig Expert Opening a Trace Switching to TraceView ...
Страница 442: ...Chapter 21 Xgig Expert 428 Xgig Analyzer User s Guide Figure 194 Xgig Expert Graph View ...
Страница 443: ...429 PART SIX Appendices ...
Страница 444: ...PART SIX Appendices 430 Xgig Analyzer User s Guide ...
Страница 454: ...Appendix C Protocol Display Color Coding 440 Xgig Analyzer User s Guide ...
Страница 461: ...447 INDEX ...
Страница 467: ......


