1
attached while collecting data
wirelessly.
3. Turn on the spectrometer by
pressing the power button once. The
Bluetooth
®
LED will blink.
4. Launch Spectral Analysis 4.
5. Click or tap Connect a
Spectrometer.
6. Click or tap your Go Direct
SpectroVis Plus from the list of
Discovered Wireless Devices. Your
spectrometer's ID is located near the
barcode on the label. The Bluetooth
LED on the sensor will now glow
blue (no longer flashing).
7. Click or tap Done to enter data-
collection mode. You are now ready
to continue your experiment.
Spectral Analysis 4
l
Chromebook: Spectral Analysis 4
l
LabQuest: LabQuest App
l
Mobile Device:
Spectral Analysis 4
4. The software will identify the
spectrometer and enter data-
collection mode. You are now
ready to continue your experiment.
Charging the Sensor
Connect Go Direct SpectroVis Plus to the included AC power cable for at least
eight hours.
Note:
This is only required for data collection via Bluetooth
wireless technology.
Charging
Orange LED next to battery icon is solid while
sensor is charging.
Fully charged
Green LED next to battery icon is solid when
sensor is fully charged.
Powering the Sensor
Turning on the sensor
Press Power button once or connect to USB.
Green LED indicator next to Power icon is solid
when unit is on.
Putting the sensor in sleep
mode
Press and hold button for more than three
seconds to put into sleep mode. Green LED
indicator turns off when sleeping.
Connecting the Sensor
See the following link for up-to-date connection information:
www.vernier.com/start/gdx-svispl
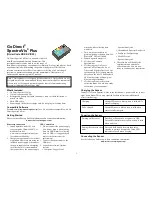
Go Direct
®
SpectroVis
®
Plus
(Order Code GDX-SVISPL)
Go Direct SpectroVis Plus is a portable, visible to
near-IR spectrophotometer and fluorometer. This
spectrophotometer can be used in a wide range of
introductory spectroscopy experiments for chemistry, biology, and physics. Such
experiments include: determining the peak wavelength to collect data on
solution concentration for Beer’s law studies, collecting a full wavelength
spectrum to measure absorbance, percent transmittance, fluorescence, or
emissions, and monitoring rates of reaction.
Note:
Vernier products are designed for educational use. Our products are not
designed nor are they recommended for any industrial, medical, or commercial
process such as life support, patient diagnosis, control of a manufacturing
process, or industrial testing of any kind.
What's Included
l
Go Direct SpectroVis Plus
l
15 plastic cuvettes and lids
l
Rechargeable battery (included inside unit; remove if data collection is
strictly via USB)
l
Micro USB cable
l
Power supply (for battery recharge only; do not plug in if taking data)
Compatible Software
See
www.vernier.com/manuals/gdx-svispl
for a list of software compatible with Go
Direct SpectroVis Plus.
Getting Started
Please see the following link for platform-specific connection information:
www.vernier.com/start/gdx-svispl
Bluetooth Connection
USB Connection
1. Install Spectral Analysis™ 4 on
your computer, Chromebook™, or
mobile device. See
www.vernier.com/spectral-analysis
for software availability.
2. Charge your spectrometer for at least
eight hours before first use using the
included power supply. Disconnect
the power supply before attempting
to collect data. It is recommended
that you not have the power supply
1. Do not connect the power supply.
You do not need it when taking
data via USB.
Note:
If collecting
data via USB, it is suggested you
remove the battery from the
spectrometer.
2. Connect the spectrometer to the
USB port.
3. Launch the software. Options
include
l
Computer: Logger
Pro
or


