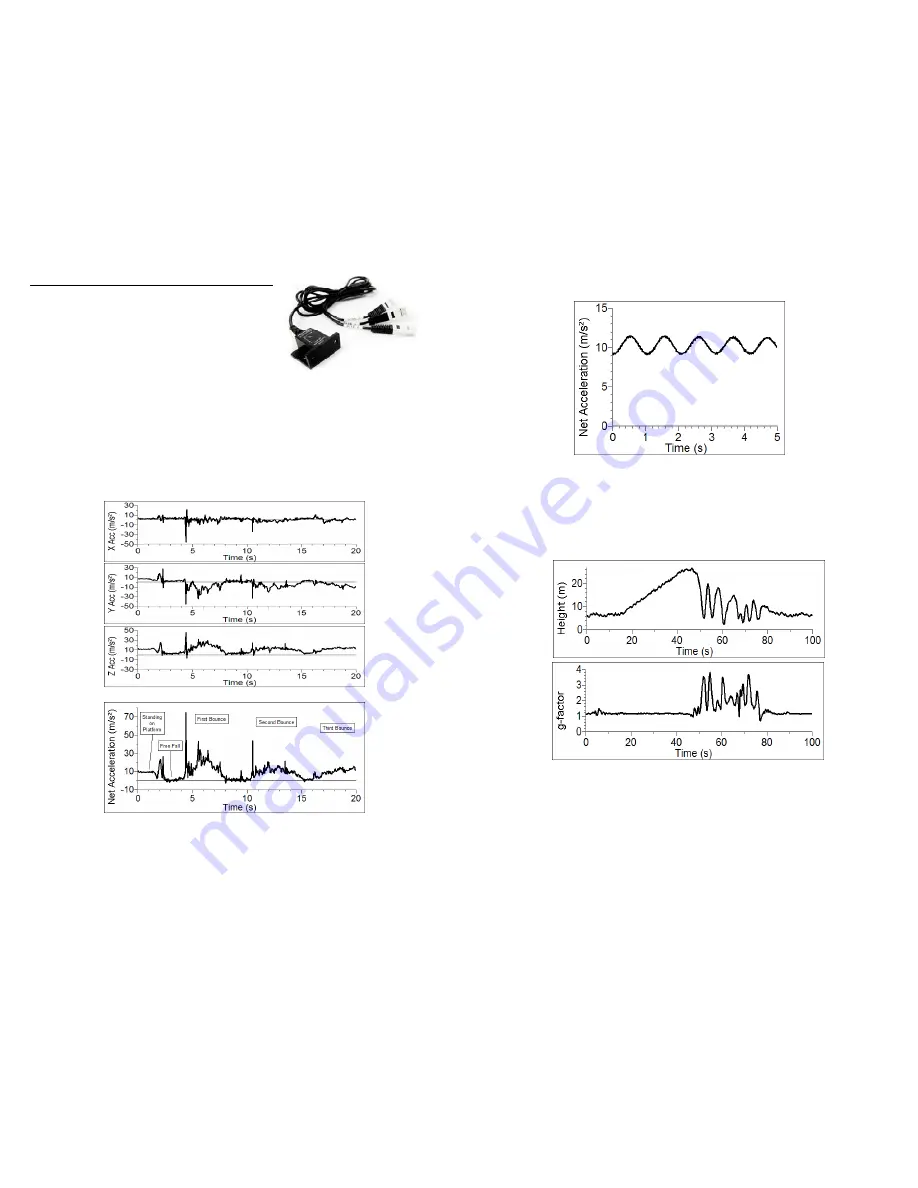
3-Axis Accelerometer
(Order Code 3D-BTA)
The 3-Axis Accelerometer consists of three –5 to
+5
g
accelerometers mounted in one small block.
Using the appropriate data collection hardware and
software, you can graph any of these components, or calculate the magnitude of the
net acceleration. The 3-Axis Accelerometer can be used for a wide variety of
experiments and demonstrations, both inside the lab and outside.
There are sample data collected with the 3-axis Accelerometer
A 3-Axis Accelerometer was used to collect data during a bungee jump. The first
three graphs show the three component accelerations. The next graph shows the net
acceleration calculated as the square root of the sum of the squares of the component
accelerations.
Bungee jump accelerations
Net acceleration
Below is a sample graph made using the 3-Axis Accelerometer mounted on a
pendulum. The pendulum is swinging through a wide angle, so the angle of the
accelerometer is changing significantly. A simple, one-dimensional accelerometer
would not have done this job as well. In this case, only the net acceleration is
2
graphed. (See the April 1995 issue of The Physics Teacher for a discussion of the
acceleration of a pendulum.)
Acceleration of a pendulum bob
The graph below shows data collected on a ride called the Vortex. A 3-Axis
Accelerometer and a Barometer were used in this experiment. A video taken during
data collection can be viewed in the Sample Movies folder of Logger
Pro
3. These
data were collected by Clarence Bakken. For more information on data collection in
an amusement park visit our web site, www.vernier.com/cmat/datapark.html, and
download the Data Collection at the Amusement Park manual.
Data collected on the Vortex


