DLKPro Inspection Key • Operating Instructions – Edition 03/2012
8 “DownloadTools” PC programme /
Breach
module
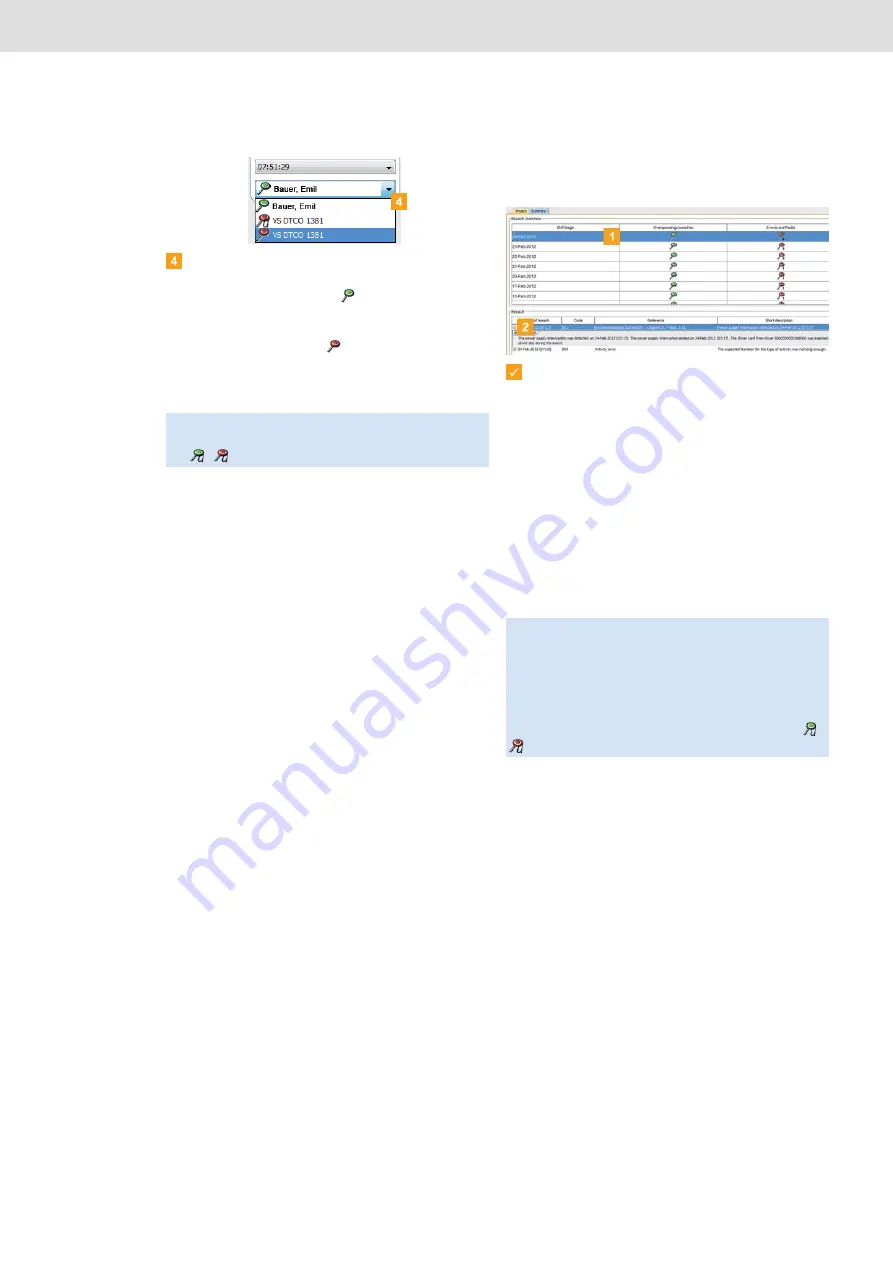
Select the vehicle and driver card data which you
want to analyse for suspicious events:
• A green signalling disc (
) is displayed if no
suspicious events exist and no infringements
have been detected.
• A red signalling disc (
) is displayed if at least
one suspicious event exists or at least one
infringement has been found.
You can now
• check the infringements found.
• view the speed graph (mass memory data) and/
or activity chart (mass memory, driver card and
workshop card data); see page 30.
• edit the selected file; see page 31.
Checking actual suspicious events and
infringements
Prerequisite:
You have chosen the
Breach
module, switched to
the
Breach
tab and selected a file.
The display and editing pane shows the summary of
suspicious events and infringements for the selected
file with information about
• the number of infringements of driving and rest
times committed by the selected driver or
• how often the selected vehicle exceeded the
programmed maximum speed and
• the number of events and faults (third column).
A detailed
Breach
list is displayed in the bottom
area of the display and editing pane.
Note
: If the mass memory file was downloaded during
the quick check, the signalling disc also shows the letter
Q (
,
).
Tip
: In the
Configuration
module on the
you can specify whether or not all days for which data
was downloaded should be analysed. You can also limit
the analysis to the last 28 days.
If you have downloaded mass memory files during the
quick check, only the data for the last two days will be
displayed. These files are denoted by the letter Q (
).


