It is tricky to get the areas correct. To help you Vaisala provides an EXCEL spreadsheet
that makes it easy to configure runway protected areas. Contact your Vaisala
representative for a copy.
After you have created your protected areas, test them with the
Overlay
utility. This requires
that you have already configured the overlay for your system. See
Overlay
in
IRIS and RDA
Utilities Guide
.
To see your protected areas on top of your overlay select
Overlay > Options > Protected
.
The display shows you the protected areas. Zoom in as needed to see them. The areas are
not labeled.
Verify that all the areas are present in the correct locations and that all of the edges are
properly aligned. If not, quit
Overlay
and then go back to IRIS setup/product to edit and
save the protected area information. Retest with
Overlay
to see if you got it right.
D.6.2 Configuring IRIS Tasks and Products for TDWR
Configuring the scan tasks and the
SLINE
and
SHEAR
products required for TDWR
operation depends on a the specific requirements of the user and the constraints of the site.
For example, some customers may require that a complete volume scan information be
collected during TDWR operation (to provide general weather monitoring) while others may
want to have the scan dedicated to low-level wind shear detection.
Most installations configure the system to switch automatically from a weather monitoring
mode to a hazard monitoring mode when there is severe weather near the terminal.
Use the example configuration as a starting point for operation. You must adjust this
example to meet your site requirements. This is typically done when your system is installed.
D.6.3 Configuring IRIS Product Outputs for TDWR
The IRIS product output configuration for the TDWR consists of:
• Output of TDWR products to the SD's (IRIS/Display Workstations with hardware and/or
virtual ribbon displays).
• Output of
SHEAR
and
SLINE
products to the TDWR/LLWAS Integrator.
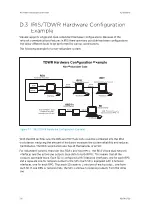
Both output configurations are made on the system where the TDWR/IRIS Integrator is
running. This is typically an IRIS/Analysis Workstation functioning as an RPG (radar product
generator). In the examples below, this node is called
cyclone
.
IRIS Product and Display User Guide
M211319EN-H
340
RESTRICTED
Содержание IRIS
Страница 1: ...M211319EN H RESTRICTED User Guide IRIS Radar IRIS Product and Display...
Страница 12: ...IRIS Product and Display User Guide M211319EN H 10 RESTRICTED...
Страница 71: ...Chapter 3 Configuring IRIS Products RESTRICTED 69...
Страница 294: ...To add icons you must include a text next to the icon IRIS Product and Display User Guide M211319EN H 292 RESTRICTED...
Страница 303: ...Figure 103 Typical Spectrum Plot Appendix A Basic Radar Meteorology RESTRICTED 301...
Страница 324: ...Figure 109 Example of Volume Rendering IRIS Product and Display User Guide M211319EN H 322 RESTRICTED...
Страница 329: ...C 8 Using the Product Information Tool Figure 113 Product Information Tool Appendix C IRIS 3DView RESTRICTED 327...
Страница 386: ......
Страница 392: ......
Страница 393: ......
Страница 394: ...www vaisala com...


