


DATA ACQUISITION
20
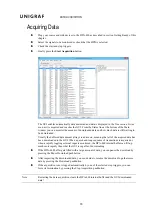
Inspecting the Acquired Data
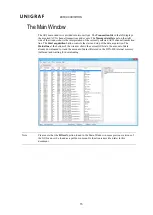
The data acquired by the DPA-400 and downloaded to the GUI is shown in the
Transaction
list.
Please refer to chapter
Customizing the Main Window
below for details on how to modify
the content and look of the
Transaction
list
.
Lines
The data is organized in lines, each numbered starting from 1 and marked with a timestamp.
There are four kinds of lines:
1.
Information lines
Identified by the text “INFO” in their Type column, they provide some useful information like
the time acquisition has started and stopped or the logical state of the inputs, etc.
2.
Transaction lines
Identified by the text “Native” or “I2C” in their Type column, they report an AUX channel
data transfer, either a data Request or a data Reply.
3.
Event lines
Identified by the text “Event” in their Type column, they signal the state change in one or more
of the monitored inputs.
4.
Sideband Channel Messages
The Isochronous Transport Service uses the sideband communications over sideband channel
(AUX CH and HPD) for the management of topology/virtual channel connection/Main Link
and performs Main Link symbol mapping.
5.
Error lines
A line Type reading “Error” marks the detection of an illegal AUX channel data packet. An
irregular start condition, an irregular stop condition or transfer of a number of bits which is not
a multiple of 8 are all conditions that cause an error line.
6.
Trace lines
Combines the data from several lines of a HDCP related message to one entry in
Message
details
panel for easier readability.
Columns
The data on each line is ordered in columns. Each column provides additional information
about the data line, facilitating its viewing and interpretation:
Line
This column displays the line number, starting from 1, and cannot be hidden.
Timestamp
Each line is identified by its timestamp, marking the instant when an event or error was
detected, or when a data transaction got started. The timestamp can be displayed as a time
delay from the start of the acquisition (absolute) or from the previous line (relative). The
timestamp can be displayed in milliseconds or in minutes, seconds and microseconds.