Exo x6a Operations Manual
revision 1
1st September 2013
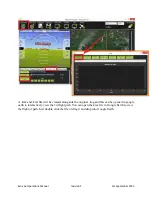
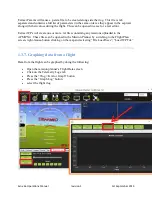
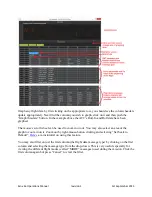
When the “Graph This” screen appears, use the left or right mouse button to click on the
checkboxes beside the items you wish to graph. Note that the items are grouped into
categories like “RC_CHANNELS” and “RAW_IMU” although it‟s still often difficult to
find exactly the item you wish to graph
If you use the left mouse button the scale for the item will appear on the left of the
graph. If you use the right mouse button it will appear on the right
Click the checkbox multiple times to cycle through all the possible colours
Change the zoom of the graph with your mouse‟s middle wheel, by select an area of the
graph with the left mouse button held down or by right-mouse-button clicking on the
graph and selecting “Set Scale To Default”
1.3.8. Video overview of tlogs
http://www.youtube.com/watch?feature=player_embedded&v=4IRRN5YMHJA
1.4. Downloading and analysing data logs in Mission Planner
1.4.1. Log Types (Dataflash vs tlogs)
There are two ways to record your flight data with ArduCopter. With some exceptions, the two
methods record very similar data but in different ways:
dataflash logs
(the subject of this page) use the APM or PX4′s onboard dataflash
memory, which you can download after the flight. On ArduPlane and ArduRover
dataflash logs are created soon after start-up. On ArduCopter they are created after you
first arm the copter.
telemetry logs
(also known as “tlogs”) are recorded by the mission planner (or other
ground station) when you connect your APM to your computer via your 3DR or Xbee
wireless telemetry link. You can find the details

