17
Chapter 4: Main Tab
airFiber
™
User Guide
Ubiquiti Networks, Inc.
Version
Displays the airFiber Configuration Interface
software version.
Uptime
This is the total time the device has been running
since the latest reboot (when the device was powered up)
or software upgrade. The time is displayed in days, hours,
minutes, and seconds.
Date
Displays the current system date and time. The
date and time are displayed in YEAR-MONTH-DAY
HOURS:MINUTES:SECONDS format. The system date and
time is retrieved from the Internet using NTP (Network
Time Protocol). The NTP Client is enabled by default on
the
Services
tab. The airFiber AF24 doesn’t have an internal
clock, and the date and time may be inaccurate if the
NTP Client is disabled or the device isn’t connected to the
Internet.
Duplex
Displays
Full Duplex
or
Half Duplex
. Full-duplex
mode allows communication in both directions
simultaneously. Half-duplex mode allows communication
in one direction at a time, alternating between
transmission and reception.
TX Frequency
Displays the current transmit frequency.
The airFiber AF24 uses the radio frequency specified to
transmit data.
RX Frequency
Displays the current receive frequency.
The airFiber AF24 uses the radio frequency specified to
receive data.
Regulatory Domain
Displays the regulatory domain
(
FCC/IC
,
ETSI
, or
Other
), as determined by country
selection.
Distance
Displays the distance between the airFiber
radios.
Current Modulation Rate
Displays the modulation rate:
•
6x (64QAM MIMO)
•
4x (16QAM MIMO)
•
2x (QPSK MIMO)
•
1x (QPSK SISO)
If
Automatic Rate Adaptation
is enabled on the
Wireless
tab,
then
Current Modulation Rate
displays the current speed
in use and depends on the
Maximum Modulation Rate
specified on the
Wireless
tab and current link conditions.
(See
“Basic Wireless Settings” on page 19
for more
details.)
RX Capacity
Displays the raw modulation rate capacity of
the link between the airFiber radios.
CONFIG MAC
Displays the MAC address of the
CONFIG
port.
CONFIG
Displays the speed and duplex of the
CONFIG
port.
DATA
Displays the speed and duplex of the
DATA
port.
Chain 0/1 Signal Strength
Displays the absolute power
level (in dBm) of the received signal for each chain.
Note:
Changing the
RX Gain
on the
Wireless
tab will
not affect the
Signal Strength
values displayed on the
Main
tab. (See
“Basic Wireless Settings” on page
for more details about
RX Gain
.)
Internal Temperature
Displays the temperatures inside
the airFiber AF24 for monitoring.
GPS Signal Quality
Displays Global Positioning System
(GPS) signal quality as a percentage value on a scale of
0-100%.
Latitude/Longitude
Based on GPS tracking, reports the
device’s current latitude and longitude. Clicking the link
opens the reported latitude and longitude in a browser
using Google Maps
™
Altitude
Based on GPS tracking, reports the device’s
current altitude relative to sea level.
Synchronization
airFiber uses GPS to synchronize the
timing of its transmissions. By default, this option is
disabled.
Monitor
There are two monitoring tools accessible via the links on
the
Main
tab. The default is
Throughput
, which is displayed
when you first open the
Main
tab.
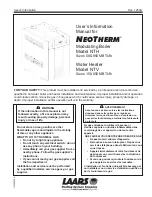
Throughput
Throughput displays the current data traffic on the
DATA
port in both graphical and numerical form. The chart scale
and throughput dimension (Bps, Kbps, Mbps) change
dynamically depending on the mean throughput value.
The statistics are updated automatically.
Refresh
If there is a delay in the automatic update, click
Refresh
to manually update the statistics.
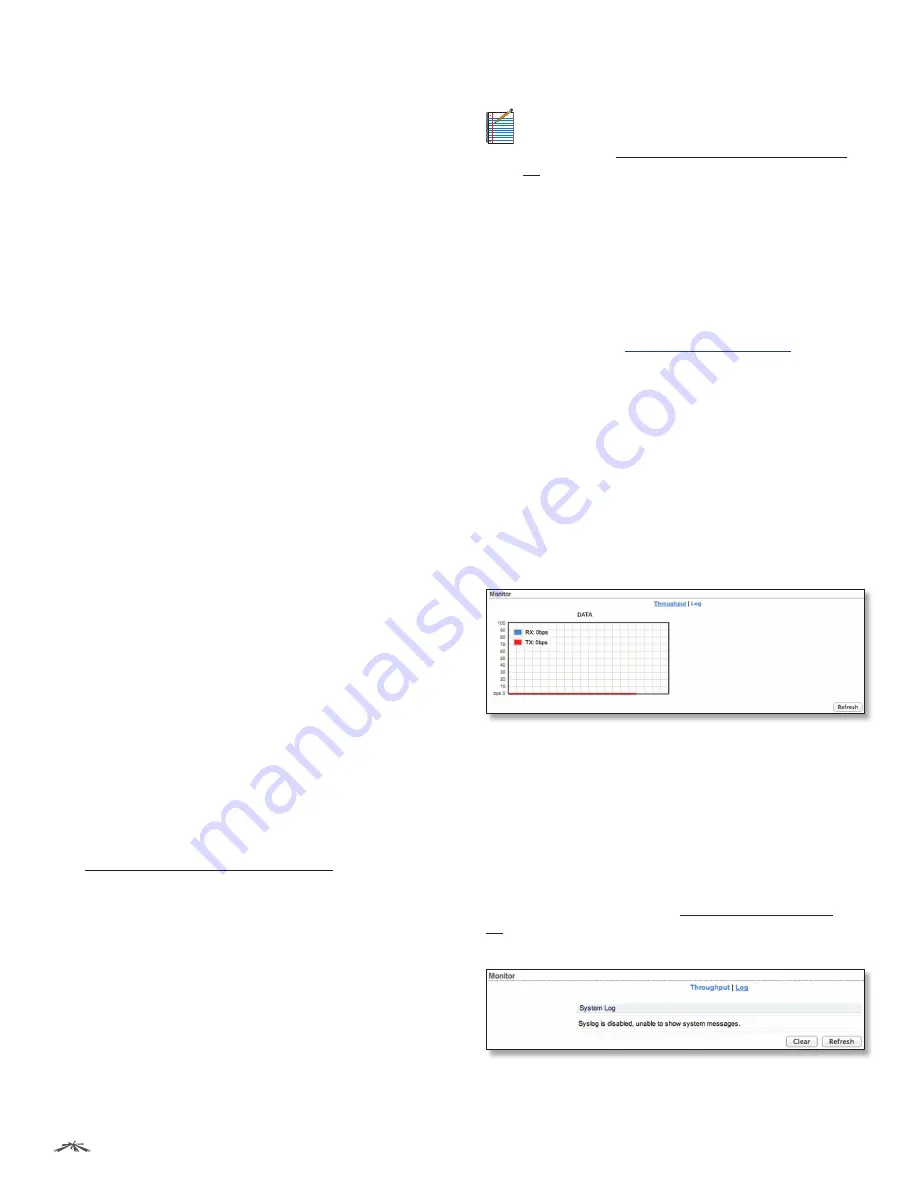
Log
When logging is enabled (see
to enable logging), this option lists all registered
system events. By default, logging is not enabled.
Clear
To delete all entries in the system log, click
Clear
.
Refresh
To update the log content, click
Refresh
.