Adding and Using User Bitmap Charts
MicronNav System
0656-SOM-00001-07
91
© Tritech International Ltd.
Any edits should then be made to Chart Editor, by first selecting a chart to Edit from the
‘Current Chart’ drop-down list (see below) and then making changes to the loaded values.
Once changes have been made, click on the ‘Save Chart’ button at the bottom of the Chart
Editor page. If the Chart is already selected and displayed on the main page, any changes
will be made instantaneously.
6.3. Deleting a Chart
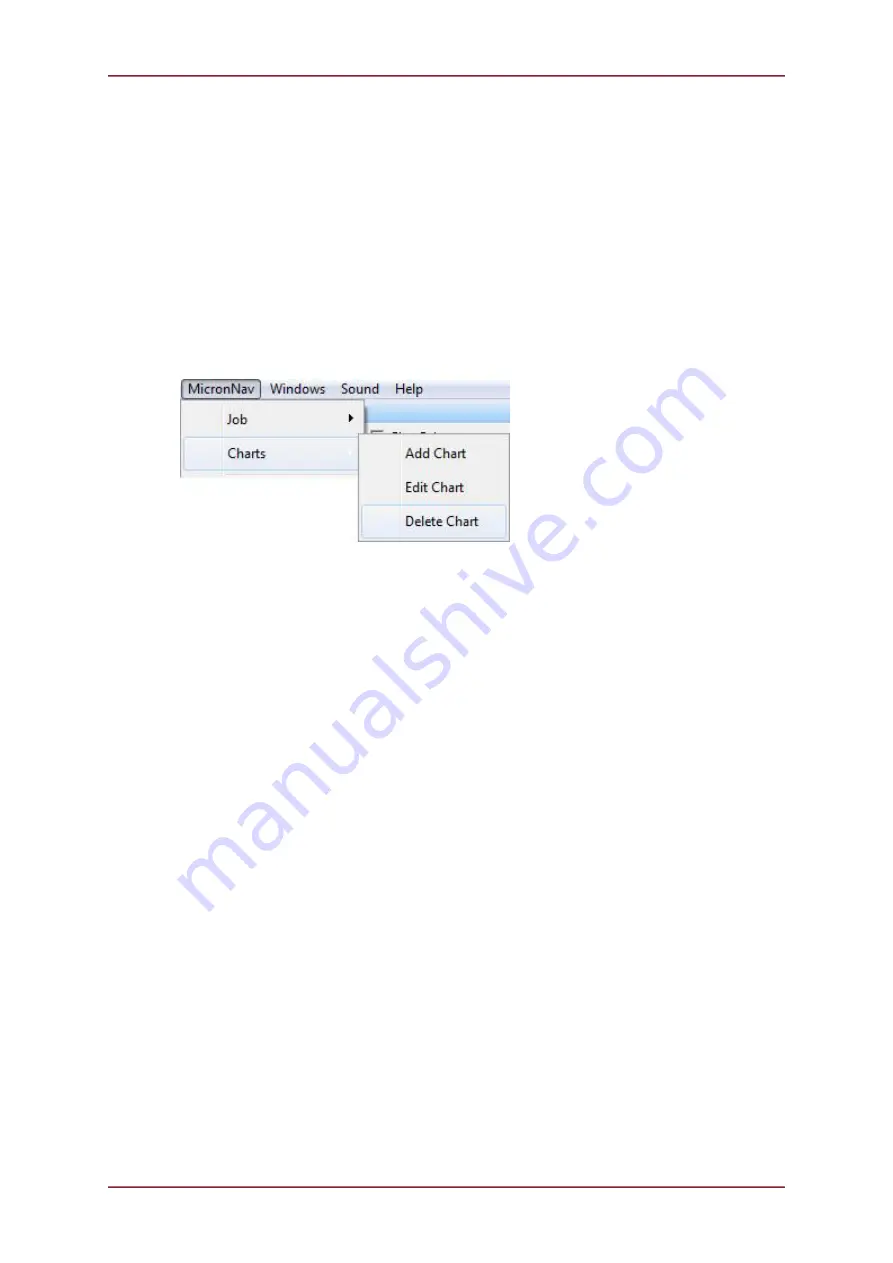
Any Chart that has been loaded into the system can be removed by selecting from the Main
menu, MicronNav – Charts – Delete Chart.
The Chart to be deleted should then be selected from ‘Current Chart’ drop-down list.
To remove the Current Chart, click on the ‘Delete’ button on the bottom of the Chart Editor
page.
6.4. Chart controls
The Chart form can be displayed by clicking on the
Display Chart
icon at the top of the
main form. Un-ticking this check-box will revert back to the PPI display.
Next to the
Display Chart
icon is the
ChartCtrl
icon. This control will toggle the display
of all the Chart Controls, which includes functions such as Zoom Chart, Display Grid, Show
Scale. If
ChartCtrl
is disabled (check-box is un-ticked) then only the Controls themselves
will be made invisible and their states will remain enabled (e.g., if Show Scale is enabled,
it will remain enabled).
The set of control buttons present on top of the Chart allow for the focus of the chart to be
manually moved around. The arrowed buttons move the chart focus around in the direction
indicated and the button with the four small arrows pointing inward will reset the focus of the
chart. The button with four arrows pointing outwards allows for the chart focus to be moved
around using mouse control when the left hand mouse button is held down.
The
Show Markers
button (to the right of the Zoom in/Zoom out controls) toggles the display
of the markers on the chart. Markers can be added by double-clicking anywhere on the chart.


