Appendix A: Functions and Instructions
897
ZoomData
CATALOG
ZoomData
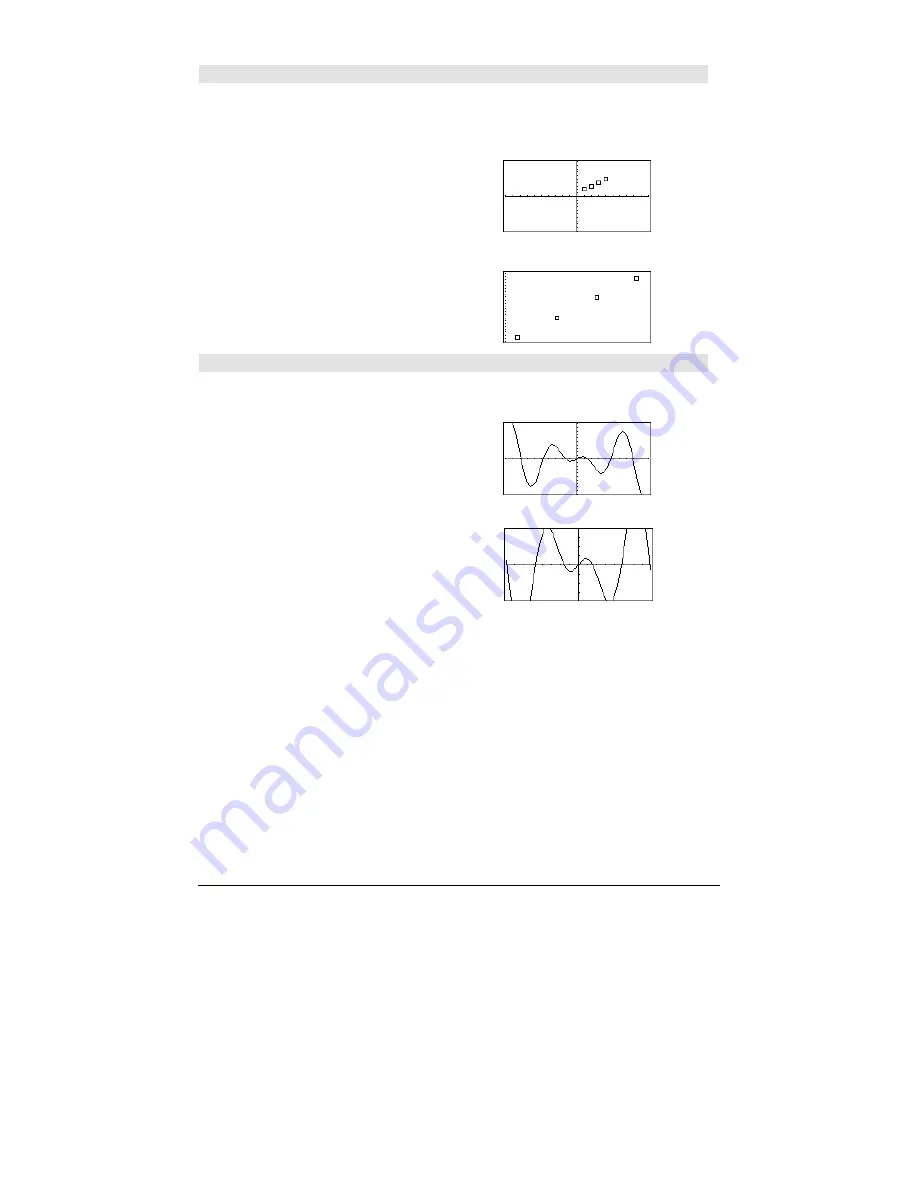
Adjusts the window settings based on the
currently defined plots (and data) so that all
statistical data points will be sampled, and
displays the Graph screen.
Note:
Does not adjust
ymin
and
ymax
for
histograms.
In function graphing mode:
{1,2,3,4}
!
L1
¸
{1 2 3 4}
{2,3,4,5}
!
L2
¸
{2 3 4 5}
newPlot 1,1,L1,L2
¸
Done
ZoomStd
¸
¥
"
ZoomData
¸
ZoomDec
CATALOG
ZoomDec
Adjusts the viewing window so that
@
x
and
@
y = 0.1
and displays the Graph screen with the
origin centered on the screen.
In function graphing mode:
1.25x
ù
cos(x)
!
y1(x)
¸
Done
ZoomStd
¸
¥
"
ZoomDec
¸
Содержание Voyage 200
Страница 36: ...Getting Started 36 D B D B Press Result ...
Страница 45: ...Getting Started 45 3 0 D B D D B D Press Result ...
Страница 46: ...Getting Started 46 D 2 0 0 2 D B Scroll down to October and press Press Result ...
Страница 60: ...Getting Started 60 B D Press Result ...
Страница 139: ...Previews 139 8 Complete the operation Press 2 d Steps and keystrokes Display 5 f 2 ...
Страница 181: ...Operating the Calculator 181 From the Keyboard From the Keyboard From the Keyboard From the Keyboard ...
Страница 453: ...Differential Equation Graphing 453 ...
Страница 468: ...Tables 468 ...
Страница 515: ...Split Screens 515 Note Both Top Bottom and Left Right splits use the same methods to select an application ...
Страница 777: ...Activities 777 ...


