
628
Using Data & Statistics
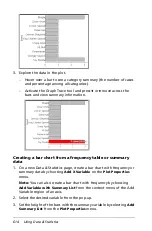
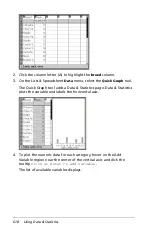
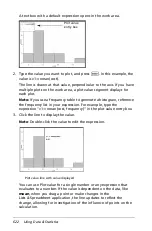
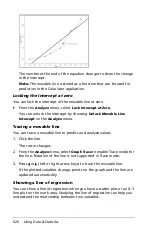
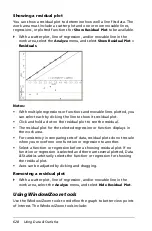
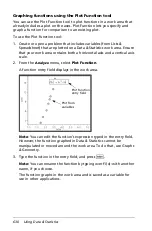
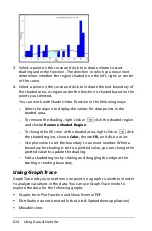
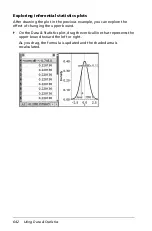
Showing a residual plot
You can show a residual plot to determine how well a line fits data. The
work area must include a scatter plot and one or more movable lines,
regressions, or plotted functions for
Show Residual Plot
to be available.
`
With a scatter plot, line of regression, and/or movable line in the
work area, select the
Analyze
menu, and select
Show Residual Plot
>
Residuals
.
Notes:
•
With multiple regressions or functions and movable lines plotted, you
can select each by clicking the line to show its residual plot.
•
Click and hold a dot on the residual plot to see the residual.
•
The residual plot for the selected regression or function displays in
the work area.
•
For consistency in comparing sets of data, residual plots do not rescale
when you move from one function or regression to another.
•
Select a function or regression before a showing residual plot. If no
function or regression is selected and there are several plotted, Data
& Statistics arbitrarily selects the function or regression for showing
the residual plot.
•
Axes can be adjusted by clicking and dragging.
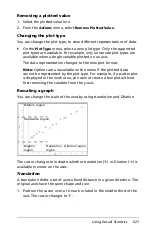
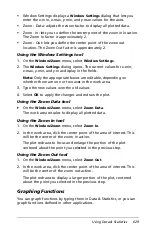
Removing a residual plot
`
With a scatter plot, line of regression, and/or movable line in the
work area, select the
Analyze
menu, and select
Hide Residual Plot
.
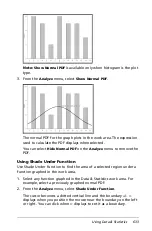
Using Window/Zoom tools
Use the Window/Zoom tools to redefine the graph to better view points
of interest. The Window/Zoom tools include:
Содержание TI-Nspire
Страница 38: ...26 Setting up the TI Nspire Navigator Teacher Software ...
Страница 46: ...34 Getting started with the TI Nspire Navigator Teacher Software ...
Страница 84: ...72 Using the Content Workspace ...
Страница 180: ...168 Capturing Screens ...
Страница 256: ...244 Embedding documents in web pages ...
Страница 332: ...320 Polling students For detailed information on viewing and sorting poll results see Using the Review Workspace ...
Страница 336: ...324 Polling students ...
Страница 374: ...362 Using the Review Workspace ...
Страница 436: ...424 Calculator ...
Страница 450: ...438 Using Variables ...
Страница 602: ...590 Using Lists Spreadsheet ...
Страница 676: ...664 Using Notes You can also change the sample size and restart the sampling ...
Страница 684: ...672 Libraries ...
Страница 714: ...702 Programming ...
Страница 828: ...816 Data Collection and Analysis ...
Страница 846: ...834 Regulatory Information ...
Страница 848: ...836 ...


