Chapter 8: Draw Instructions
129
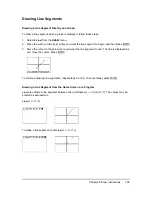
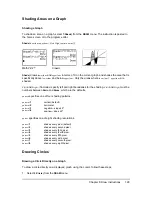
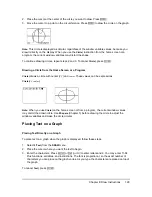
2. Place the cursor at the center of the circle you want to draw. Press
Í
.
3. Move the cursor to a point on the circumference. Press
Í
to draw the circle on the graph.
Note:
This circle is displayed as circular, regardless of the window variable values, because you
drew it directly on the display. When you use the
Circle(
instruction from the home screen or a
program, the current window variables may distort the shape.
To continue drawing circles, repeat steps 2 and 3. To cancel
Circle(
, press
‘
.
Drawing a Circle from the Home Screen or a Program
Circle(
draws a circle with center (
X,Y
) and
radius.
These values can be expressions.
Circle(
X,Y,radius
)
Note:
When you use
Circle(
on the home screen or from a program, the current window values
may distort the drawn circle. Use
ZSquare
(Chapter 3) before drawing the circle to adjust the
window variables and make the circle circular.
Placing Text on a Graph
Placing Text Directly on a Graph
To place text on a graph when the graph is displayed, follow these steps.
1. Select
0:Text(
from the
DRAW
menu.
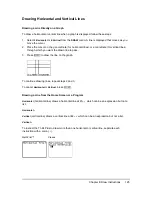
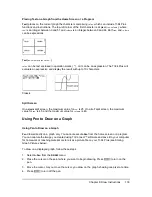
2. Place the cursor where you want the text to begin.
3. Enter the characters. Press
ƒ
or
y
7
to enter letters and
q
. You may enter TI-84
Plus functions, variables, and instructions. The font is proportional, so the exact number of
characters you can place on the graph varies. As you type, the characters are placed on top of
the graph.
To cancel
Text(
, press
‘
.


