


Chapter 4: Parametric Graphing
95
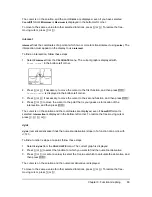
Displaying a Graph
When you press
s
, the TI-84 Plus plots the selected parametric equations. It evaluates the X
and Y components for each value of
T
(from
Tmin
to
Tmax
in intervals of
Tstep
), and then plots
each point defined by X and Y. The window variables define the viewing window.
As the graph is plotted, X, Y, and T are updated.
Smart Graph applies to parametric graphs.
Window Variables and Y
.
VARS Menus
You can perform these actions from the home screen or a program.
•
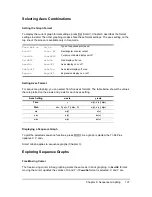
Access functions by using the name of the
X or Y component of the equation as a variable.
•
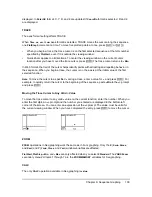
Store parametric equations.
•
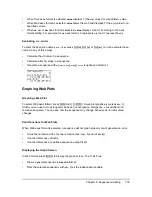
Select or deselect parametric equations.
•
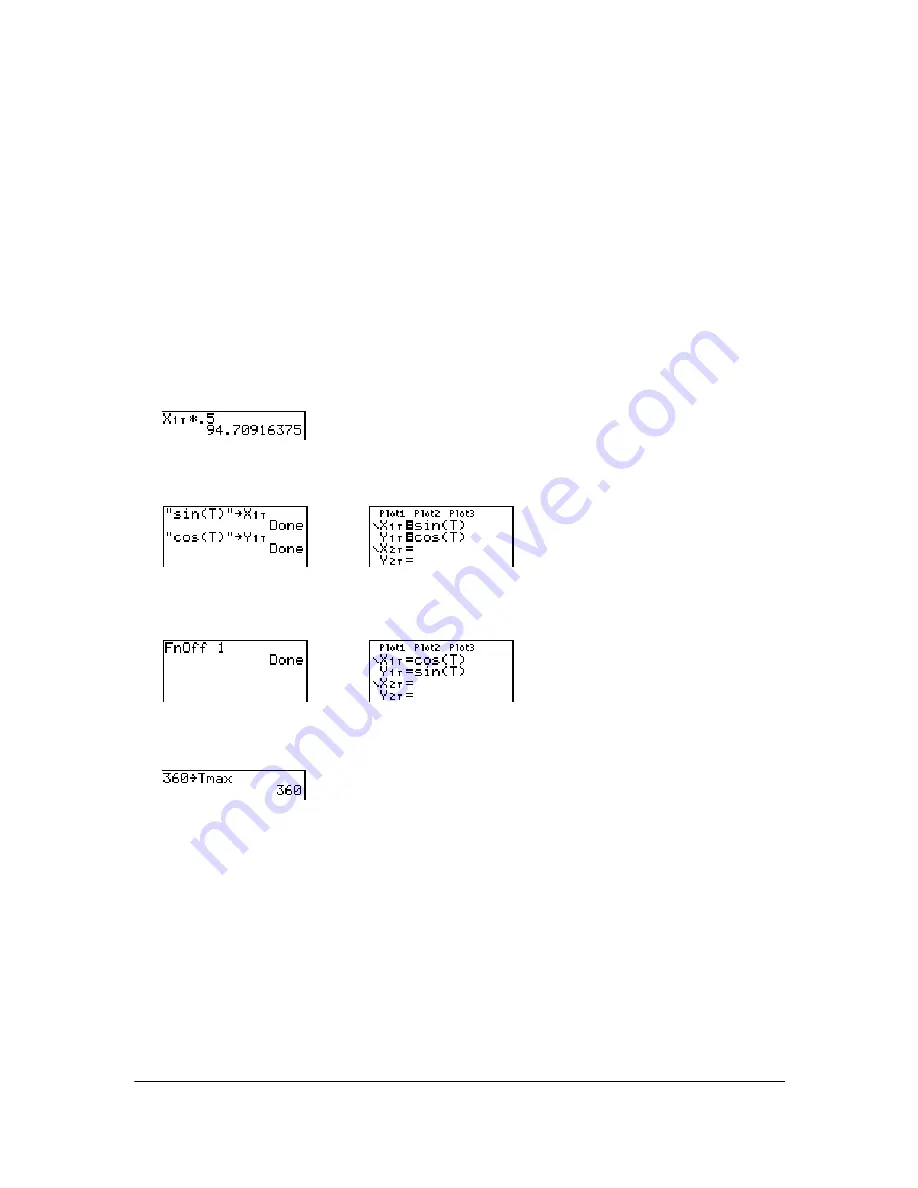
Store values directly to window variables.
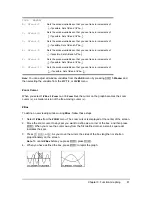
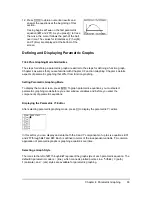
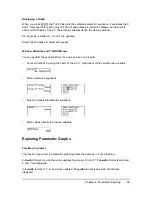
Exploring Parametric Graphs
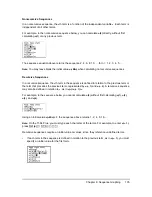
Free-Moving Cursor
The free-moving cursor in parametric graphing works the same as in Func graphing.
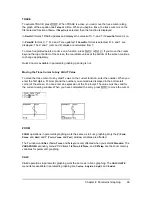
In
RectGC
format, moving the cursor updates the values of X and Y; if
CoordOn
format is selected,
X and Y are displayed.
In
PolarGC
format, X, Y, R, and
q
are updated; if
CoordOn
format is selected, R and
q
are
displayed.


