
TI-83 Plus
Polar Graphing
170
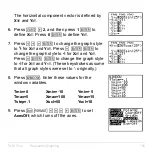
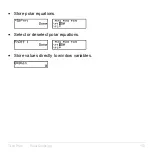
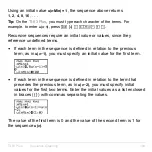
To change the selection status, move the cursor onto the
=
sign, and
then press
Í
.
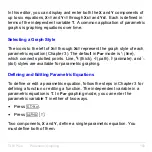
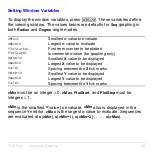
Setting Window Variables
To display the window variable values, press
p
. These variables
define the viewing window. The values below are defaults for
Pol
graphing in
Radian
angle mode.
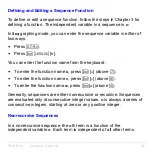
q
min=0
Smallest
q
value to evaluate
q
max=6.2831853
...
Largest
q
value to evaluate (2
p
)
q
step=.1308996
...
Increment between
q
values (
pà
24)
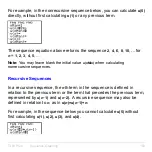
Xmin=
L
10
Smallest
X
value to be displayed
Xmax=10
Largest
X
value to be displayed
Xscl=1
Spacing between the
X
tick marks
Ymin=
L
10
Smallest
Y
value to be displayed
Ymax=10
Largest
Y
value to be displayed
Yscl=1
Spacing between the
Y
tick marks
Note: To ensure that sufficient points are plotted, you may want to change the
q
window variables.
Содержание 83PL/CLM/1L1/V - 83 Plus Calc
Страница 228: ...TI 83 Plus Draw Instructions 225 DrawInv expression Note You cannot use a list in expression to draw a family of curves...
Страница 293: ...TI 83 Plus Lists 290 Using Lists in Graphing You can use lists to graph a family of curves Chapter 3...
Страница 407: ...TI 83 Plus Inferential Statistics and Distributions 404 Input Calculated results Drawn results...
Страница 412: ...TI 83 Plus Inferential Statistics and Distributions 409 Data Stats Input Calculated results...
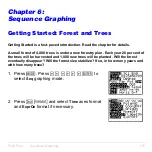
Страница 446: ...TI 83 Plus Applications 443 3 Press to place the cursor on the prompt 4 Press to solve for the annual interest rate...
Страница 454: ...TI 83 Plus Applications 451 tvm_FV tvm_FV computes the future value tvm_FV PV PMT P Y C Y...