

TI-83 Plus
Function Graphing
129
Displaying Graphs
Displaying a New Graph
To display the graph of the selected function or functions, press
s
.
TRACE
,
ZOOM
instructions, and
CALC
operations display the graph
automatically. As the
TI-83 Plus
plots the graph, the busy indicator is on.
As the graph is plotted,
X
and
Y
are updated.
Pausing or Stopping a Graph
While plotting a graph, you can pause or stop graphing.
•
Press
Í
to pause; then press
Í
to resume.
•
Press
É
to stop; then press
s
to redraw.
Smart Graph
Smart Graph is a
TI-83 Plus
feature that redisplays the last graph
immediately when you press
s
, but only if all graphing factors that
would cause replotting have remained the same since the graph was last
displayed.
Содержание 83PL/CLM/1L1/V - 83 Plus Calc
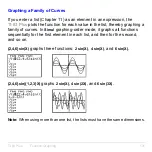
Страница 228: ...TI 83 Plus Draw Instructions 225 DrawInv expression Note You cannot use a list in expression to draw a family of curves...
Страница 293: ...TI 83 Plus Lists 290 Using Lists in Graphing You can use lists to graph a family of curves Chapter 3...
Страница 407: ...TI 83 Plus Inferential Statistics and Distributions 404 Input Calculated results Drawn results...
Страница 412: ...TI 83 Plus Inferential Statistics and Distributions 409 Data Stats Input Calculated results...
Страница 446: ...TI 83 Plus Applications 443 3 Press to place the cursor on the prompt 4 Press to solve for the annual interest rate...
Страница 454: ...TI 83 Plus Applications 451 tvm_FV tvm_FV computes the future value tvm_FV PV PMT P Y C Y...


