April 2019
Fourth Edition - Third Printing
Part No.
57.0009.0619GT
GTH-5519 59
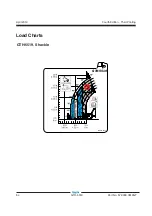
Load Charts
New Horizontal Load Center, measured from front vertical surface of fork arm
24 in /
61 cm
or less
28 in /
71 cm
or less
32 in /
81 cm
or less
36 in /
91 cm
or less
40 in /
102 cm or
less
44 in /
112 cm or
less
48 in /
122 cm or
less
54 in /
137 cm or
less
Capacity
Reduction
Factor
1.00 0.86 0.75 0.67 0.60 0.55
0.50
0.44
24 in /
61 cm
24 in /
61 cm
Use Capacity
Reduction Factor
x Rated Load
24 in /
61 cm
Use Load Chart
24 in / 61 cm
Load Center or less
Load Center greater than
24 in / 61 cm
48 in / 122 cm
Load Center
24 in /
61 cm
Determine Load Center
1000 lbs / 454 kg
X
48 in /
122 cm
or less
0.50
=
Rated load
x
Capacity Reduction Factor
=
Reduced Rated Load
1000 lbs / 454 kg
x
0.50
=
500 lbs / 227 kg
EXAMPLE
Load Capacity Field Calculations
Always center the load on the forks. Position the
load so that it is completely against the back of
the fork frame. Fork length should always be at
least 2/3 the load length.
All Genie telehandler fork carriage load charts are
based on a horizontal load center that is 24 in /
61 cm from the front vertical surface of the fork
arm. For loads with a load center exceeding this
value, refer to the table and instructions below to
determine the reduced load capacity for a specific
load zone. Note that this does not account for a
load center that is not centered between the forks
or a vertical load center exceeding 24 in / 61 cm
from the top face of the fork tine. Keep the load
centered on the fork carriage.
To calculate the new reduced load capacity at a
load center greater than the standard 24 in / 61
cm load center, multiply the zone capacity from
the load chart by the appropriate reduction factor
listed in the table below. Refer to the example.


