56
Operation
SeaBat UI - User Manual
4.11.7 Sidescan
The Sidescan screen shows an image of the seafloor which can be used
to locate and identify features and bottom conditions. Each sonar ping is
used to generate a line of data. Each line contains a series of amplitudes
representing the signal return versus time or range. When a series of
these lines is combined and displayed as the vessel moves along the
track, a two-dimensional image is formed, providing a detailed picture of
the bottom along either side of the vessel.
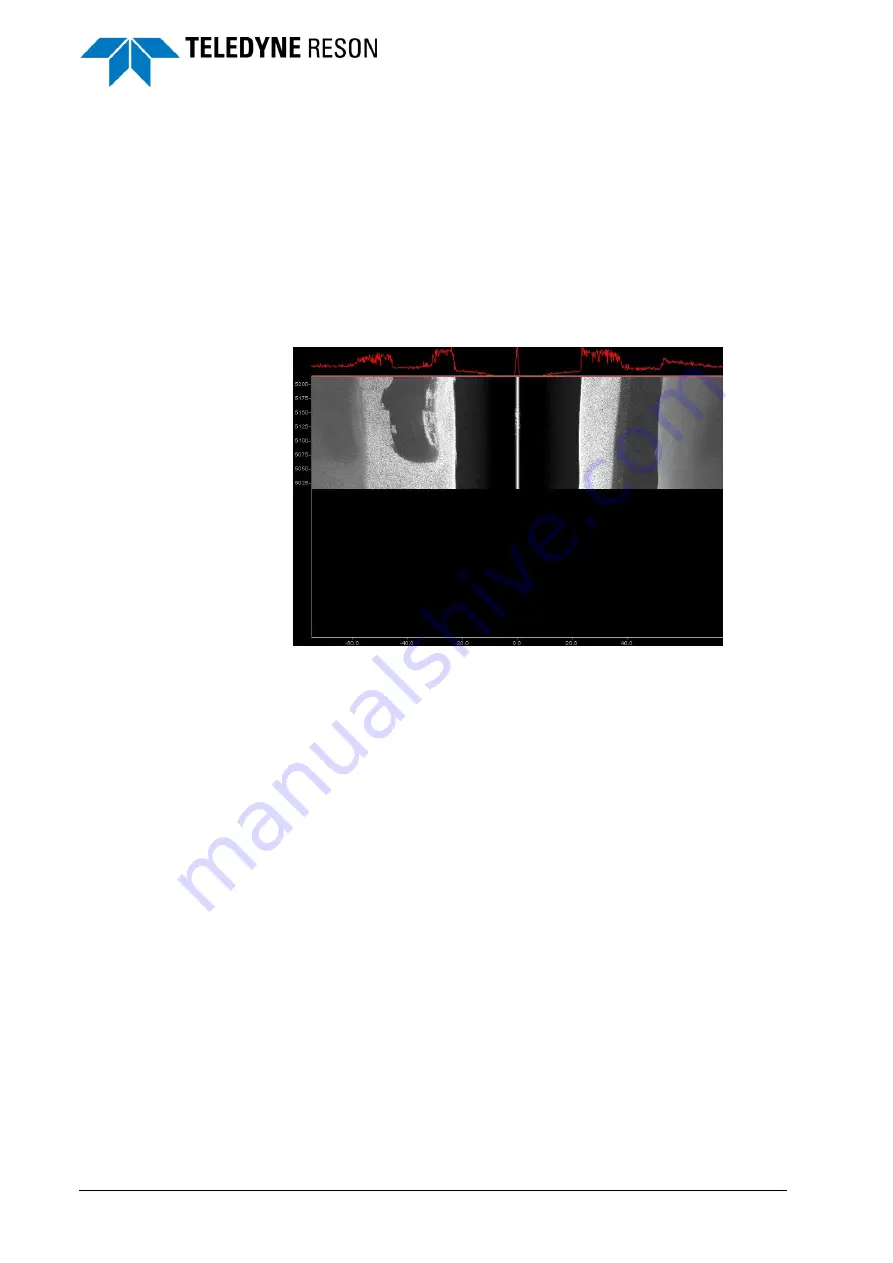
The sidescan data can be viewed on a waterfall display representing the
results of a peak-detect search through the left and right beams of the
swath.
Figure 4-81
Sidescan screen
By default the scaling of the data is set on Auto Scaling. Deactivate the
Auto button in the toolbar and the operator can manually set the
threshold, gain and TVG for the picture in the Sidescan screen.
Side-scan cannot be used to accurately measure true depths, but it can
provide a more detailed picture of the seafloor. This image can be used
together with bathymetry to identify features and to help ensure that the
survey does not miss any small but significant targets.


