


3 – Operating software
3-16
© Teledyne Limited
DPN 402197 Issue 7.1
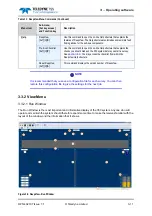
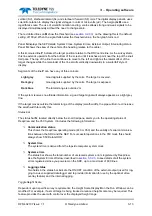
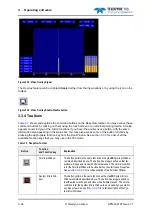
Figure 3-7: Scope Window
The above screen shows an example of the 350 Scope Window with panels for six active channels.
During operation, each of these display panels shows the signal voltage measured on their respective
channels against a horizontal time scale and a vertical scale of percentage of full scale or
V. In the
example above the panels are showing a variety of timebase scales.
Unless the signal from the target cable is very strong, you are unlikely to see a clearly defined sine-
wave oscillogram.
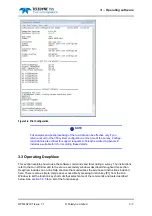
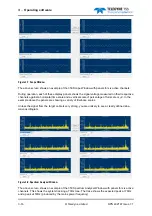
Figure 3-8: Spectrum Analyser Window
The above screen shows an example of the 350 Spectrum Analyser Window with panels for six active
channels. This shows the system tracking a 70Hz tone. The trace shows the expected peak at 70Hz
and a peak at 50Hz (produced by the mains power frequency).