CTD-ES and CTD-ER Technical Manual
page 38
EAR-Controlled Technology Subject to Restrictions Contained on the Cover Page.
10. Click OK to save the new graph setup and close the Pressure Graph 1 Setup dialog box, or
click Cancel to close the dialog box without saving any changes.
11. Except for Step 1, repeat all the steps above for the Pressure Graph 2, Pressure Graph 3 and
Pressure Graph 4 graphs, or for only those graphs you want to display.
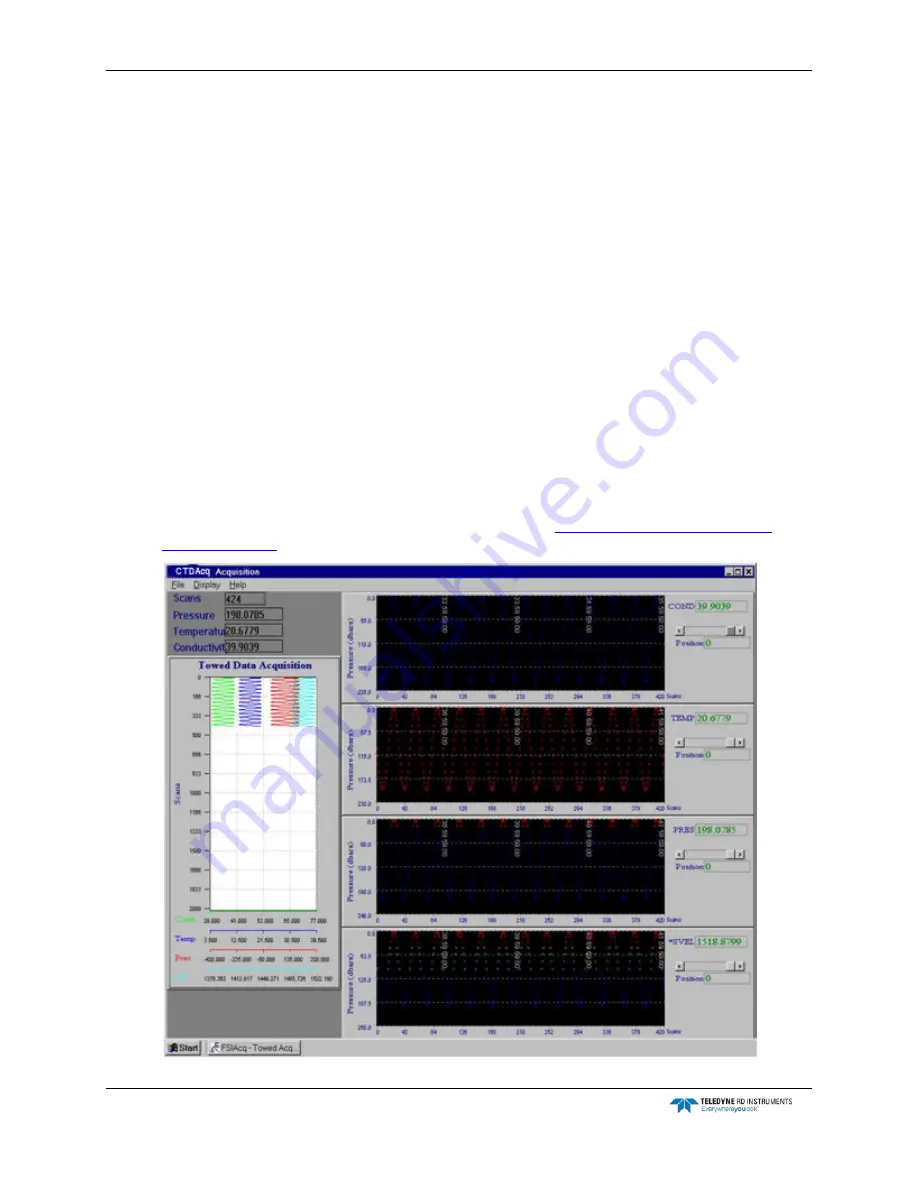
If you choose to show all the pressure graphs, CTDAcq displays them as shown in Figure 20,
which includes pressure plots of conductivity, temperature, pressure, and calculated sound
velocity.
Displaying the Cast Graph in the Towed Acquisition
Graphics Display
To display the cast graph in the Towed Acquisition graphics display, choose Display
➤
Cast
Graph
➤
Enable.
The cast graph opens to the left of the pressure graphs as shown in Figure 20.
Setting up the Cast Graph from the Towed Acquisition
Graphics Display
To set up the cast graph from the Towed Acquisition graphics display, choose Display
➤
Cast
Graph
➤
Setup, and then set up the graph as described in
Setting up the Graph in the Cast


