56
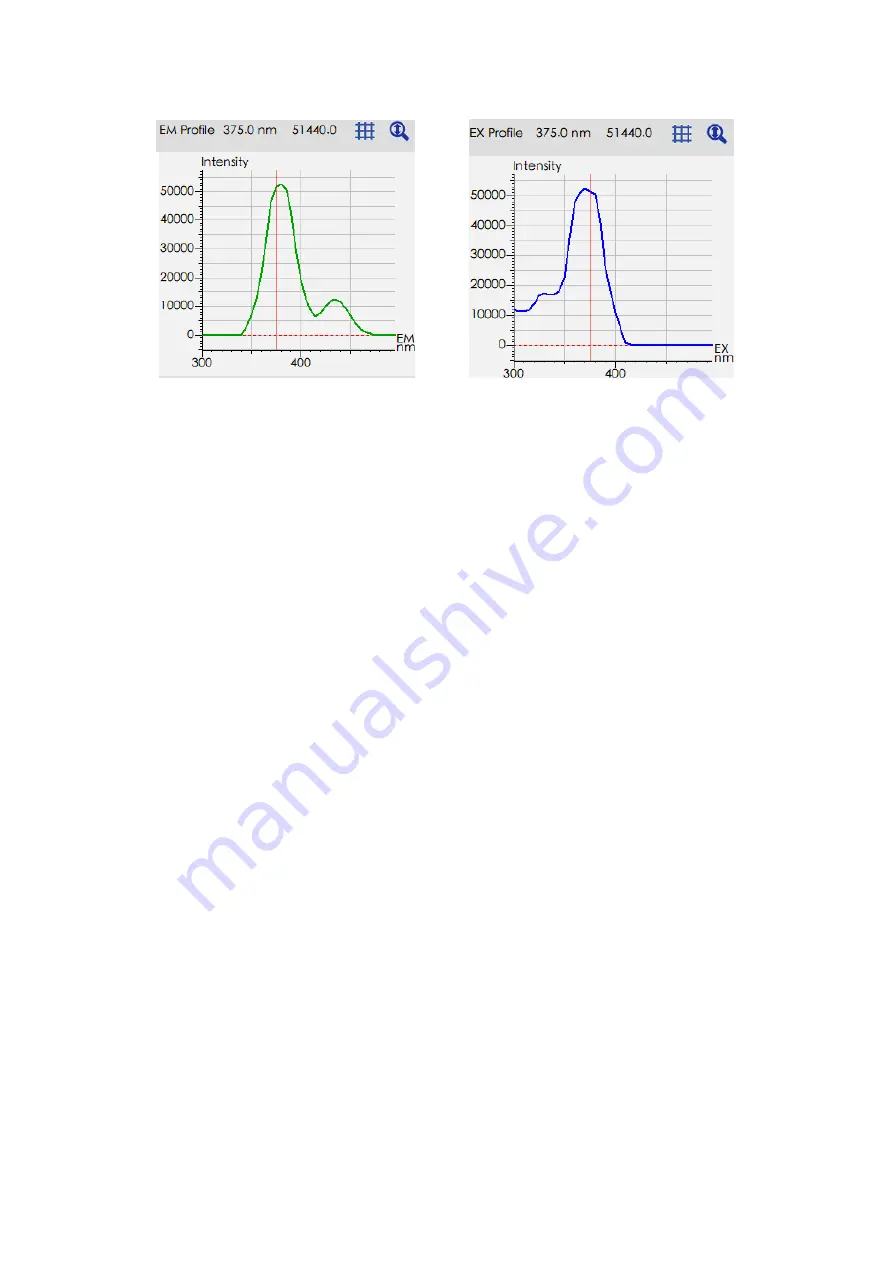
Figure 3-48 Profiles of EM and EX of clicking any location of 3D spectra
Figure 3-48 are the cross section diagrams of EX and EM, the EX cross section and EM
cross section of the current click location can be selected when clicking the 3D spectra.
3.8.3 Stop
Click “Stop” to end the 3D scan.


